


 Price: ETFs Buy $240M on Friday as Price Hits Six-Week High")


TLDR
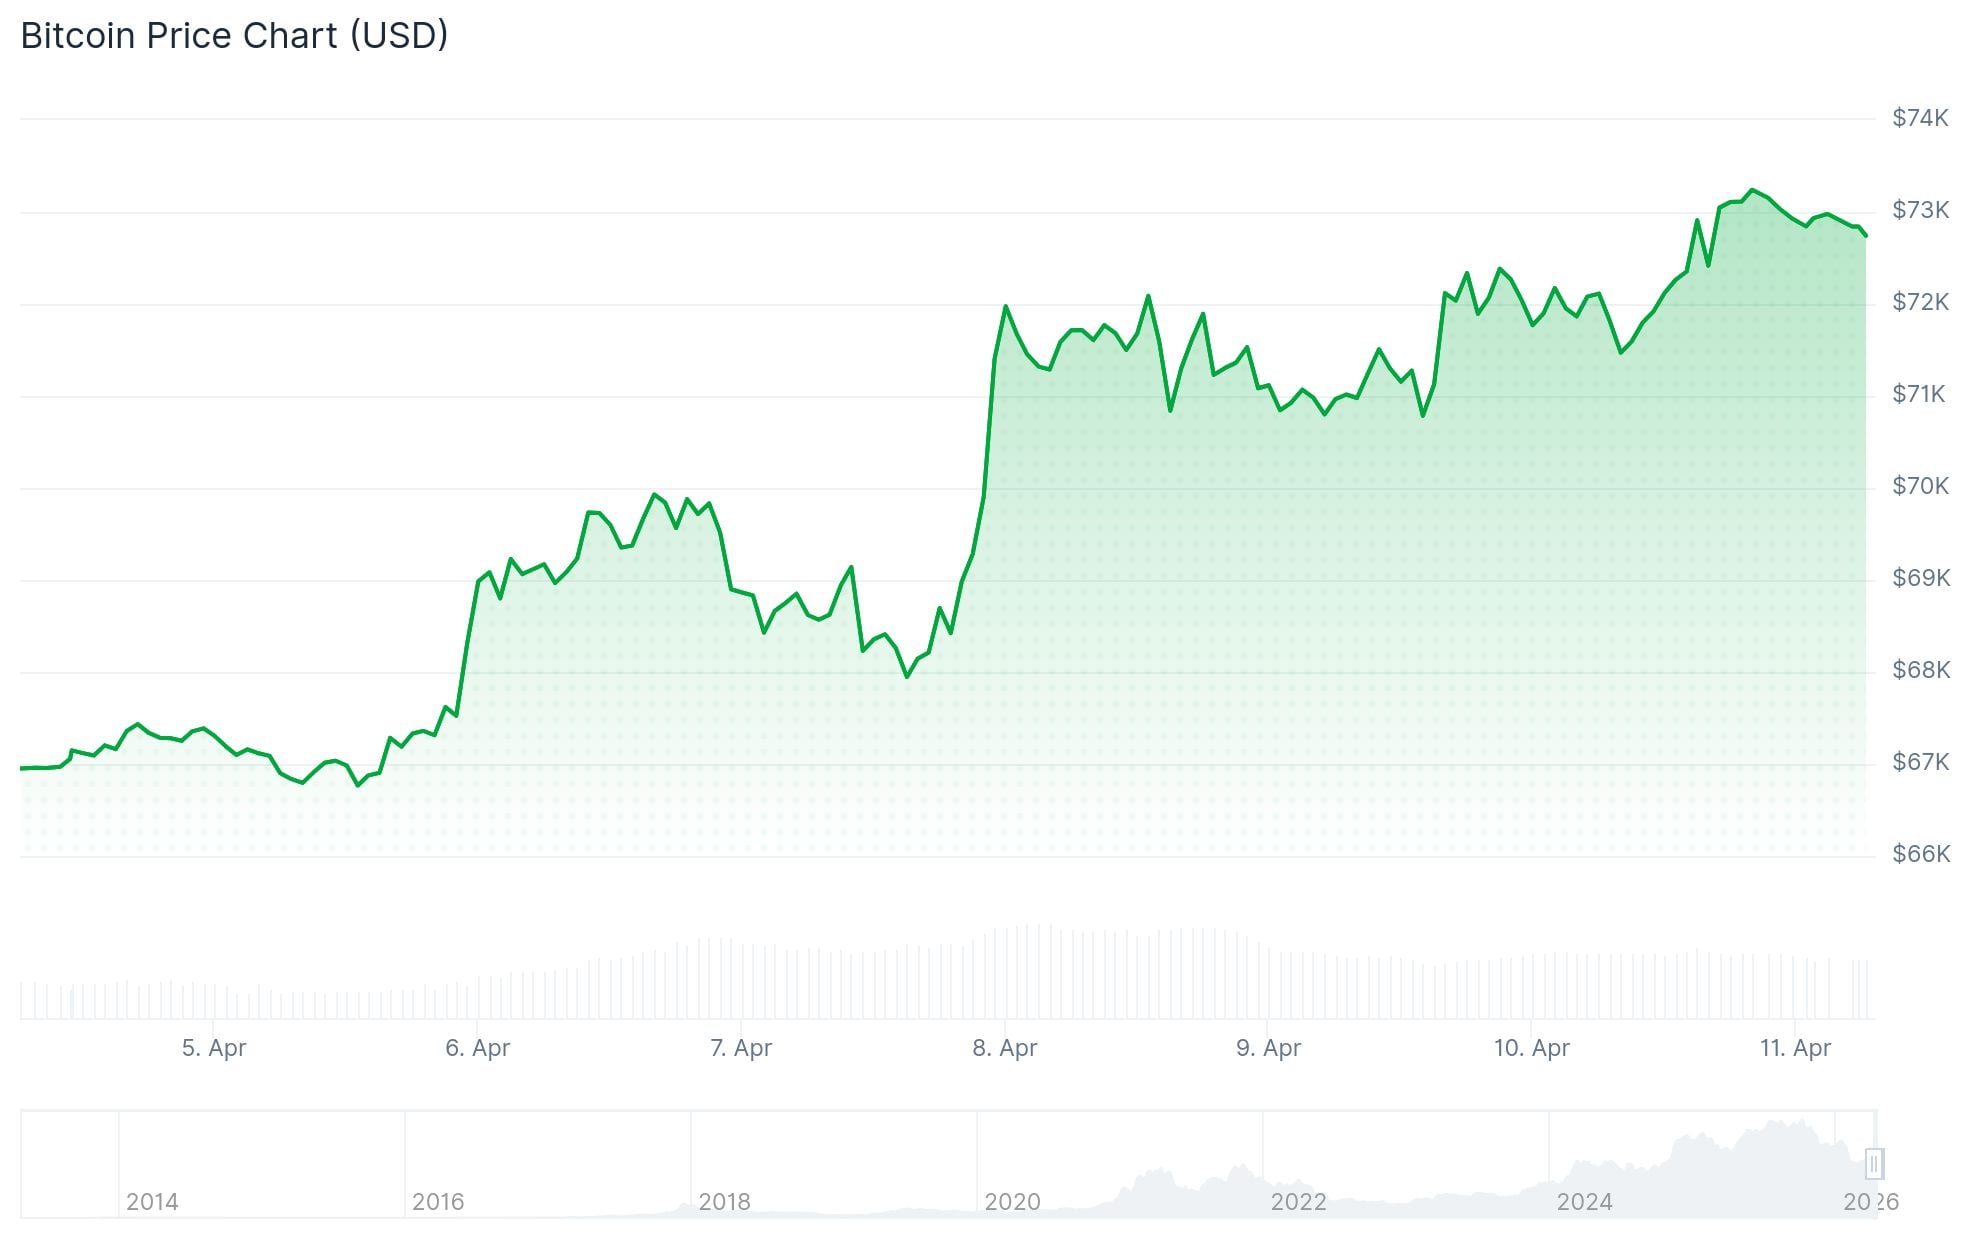
- Bitcoin broke above a bear pennant pattern and hit a six-week high of $73,300
- Glassnode identifies a key resistance zone between $78,000 and $80,000
- Polymarket traders now give a 26% chance of BTC reaching $80,000 in April
- Bitcoin ETFs bought 3,350 BTC worth $240 million in a single day
- A U.S.-Iran ceasefire and easing macro fears helped push BTC up nearly 9% for the week
Bitcoin rallied above $73,000 on Friday, reaching a six-week high of $73,300 after breaking out of what had appeared to be a bear pennant pattern on the daily chart. The move came with rising trading volume, which analysts say shows stronger conviction behind the push higher.
The BTC/USD pair broke above the pennant’s upper trend line at $70,000, jumping 7% in a single session. Along the way, Bitcoin reclaimed several key moving averages, including the 200-week EMA at $68,350 and the 50-day EMA at $70,580.
A symmetrical triangle pattern has also formed on the daily chart. If that pattern plays out fully, the measured price target sits at $87,000, roughly 20% above current levels. The RSI is also showing bullish divergence, meaning momentum has been building steadily over the past two months.
#btc/usd
Bitcoin is poised to break out from the descending triangle pattern on the 4H chart
If confirmed, we could see $BTC surge toward $81,500🎯👇Crypto Traders-join Telegram👇 https://t.co/oRAVD0i3ly
. pic.twitter.com/XdpyjHiPpS— Whales_Crypto_Trading 🐋 (@WHALES_CRYPTOt) April 10, 2026
Bitcoin’s next technical hurdle is the 100-day EMA near $75,400. A rejection at that level could weaken the current breakout.
What Onchain Data Says About $80K
Glassnode data puts a clearer ceiling on the near-term move. The firm’s risk indicator flags meaningful resistance between the true market mean at $78,000 and the short-term holder cost basis near $80,000.
“Any rally into this zone is likely to encounter meaningful distribution pressure from recent buyers seeking to exit at or near breakeven,” Glassnode said in its latest Week Onchain report.
Their Entity-Adjusted URPD data shows BTC has entered a relatively open zone between $72,000 and $82,000, with less supply overhead in that range. However, more than 1.3 million BTC were acquired between $82,000 and $85,000, which could act as a ceiling.

Analyst Ali Charts posted on X that $75,300 is acting as a “magnet” for Bitcoin, noting a large liquidity pool sitting just above $72,000. He said a move to $75,300 could wipe out around $80 million in short positions, potentially triggering a cascade of liquidations.
$75,300 is a magnet for Bitcoin $BTC!
Bitcoin has reclaimed the $72,000 level, and the focus is now shifting to the massive liquidity pool sitting just above it. The shorts are trapped, and the "exit door" is getting very narrow.
A move to $75,300 would wipe out approximately… pic.twitter.com/2UHROLM3GQ
— Ali Charts (@alicharts) April 10, 2026
ETF Demand and Macro Backdrop
On the institutional side, Bitcoin Archive reported on X that Bitcoin ETFs purchased 3,350 BTC worth $240 million in a single day. ETFs now hold a combined 721,090 BTC, valued at approximately $56.75 billion.
Bitcoin ETFs bought 3,350 BTC worth $240M yesterday.
ETFs now hold 721,090 BTC worth $56.75 Billion. pic.twitter.com/tuSNw64wCT
— Bitcoin Archive (@BitcoinArchive) April 11, 2026
Macro conditions also shifted in Bitcoin’s favor this week. A U.S.-Iran ceasefire helped lift risk assets broadly, pushing BTC toward a weekly gain of nearly 9% — its best week since October 2025.
March CPI came in at 3.3%, driven largely by a 10.9% surge in energy costs. Core inflation, however, rose just 0.2% for the month.
On Polymarket, traders now put a 26% chance on BTC hitting $80,000 in April, up 5% in 24 hours. The odds of reaching $75,000 stand at 76%.
Bitcoin ETFs held 721,090 BTC worth $56.75 billion as of Friday.


