


 Price: Extreme Fear Signals Potential Bottom as Selling Exhausts")
TLDR
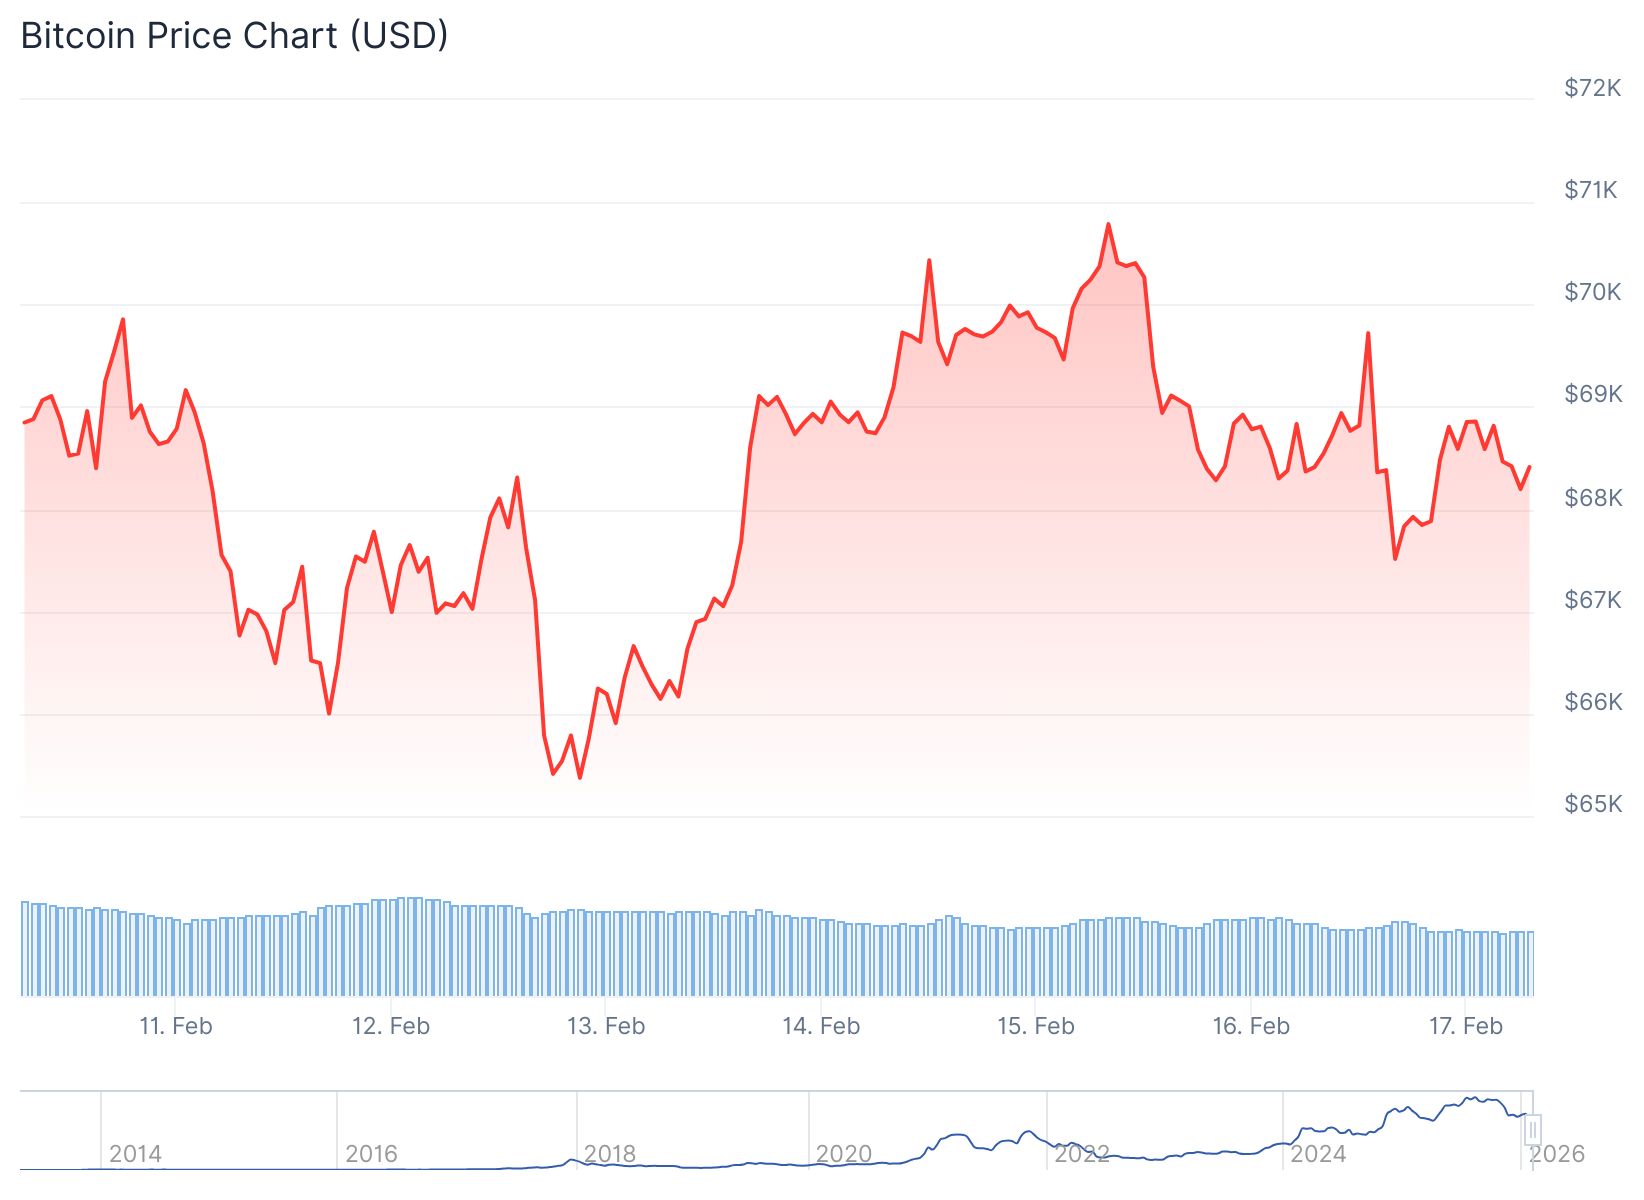
- Bitcoin traded around $68,000 on Tuesday as cryptocurrency markets remained quiet due to holidays in major markets and caution ahead of U.S. economic data releases.
- Bitcoin has fallen nearly 50% from its October record high and briefly dropped below $60,000 last week, extending a months-long sector-wide decline.
- Sentiment indicators show “extreme fear” at four-year lows, with analysts suggesting this could signal a potential market bottom as selling pressure becomes exhausted.
- Spot Bitcoin ETFs recorded $360 million in net outflows last week, while exchange data shows increased whale accumulation with large entities moving coins off exchanges.
- Bitcoin is on track for its worst first quarter since 2015, down over 21% year-to-date, with derivatives markets showing crowded short positions that could trigger volatility.
Bitcoin traded at $68,056 on Tuesday morning as cryptocurrency markets showed little movement during holiday-thinned trading conditions. The price represents a 0.5% decline from the previous session.
Markets remained cautious ahead of several U.S. economic data releases scheduled for the coming days. Industrial production figures, trade data, and the PCE price index are all due this week. The Federal Reserve’s January meeting minutes will also be released.
Bitcoin has experienced a steep decline from its October record high. The cryptocurrency has lost nearly 50% of its value during this period. Last week, Bitcoin briefly fell below the $60,000 level before recovering slightly.
The decline has been part of a broader months-long selloff across the cryptocurrency sector. Recent losses accelerated after concerns emerged about U.S. monetary policy under Kevin Warsh, President Donald Trump’s nominee for Federal Reserve Chairman. Warsh is viewed as less dovish than some market participants had hoped.
The cryptocurrency is currently trading well below $70,000 and has struggled to reclaim that level. Bitcoin closed below $70,000 late last week after briefly crossing above the threshold.
Sentiment Reaches Extreme Levels
Market sentiment indicators have fallen to their lowest levels in four years. The Alternative.me Fear and Greed Index shows a reading of 10 out of 100, indicating “extreme fear.” This matches the lowest levels seen since June 2022.
📊Today’s #Matrixport Daily Chart – February 17, 2026 ⬇️
Bitcoin Sentiment Hits Extreme Lows ⁰— Durable Bottom Are Emerging?
#Matrixport #Bitcoin #BTC #CryptoMarkets #MarketSentiment #FearAndGreed #RiskManagement #Volatility #CryptoResearch pic.twitter.com/WxJg3xrHSf
— Matrixport Official (@Matrixport_EN) February 17, 2026

Matrixport analysts noted that their Bitcoin fear and greed index suggests potential market stabilization. The firm stated that “durable bottoms” typically form when the 21-day moving average drops below zero and reverses higher. This pattern is currently occurring.
Frank Holmes, chairman of Bitcoin mining firm Hive, said Bitcoin is now roughly two standard deviations below its 20-day trading norm. This has only happened three times in the past five years. Holmes added that such extreme levels have historically led to short-term bounces over the following 20 trading days.
If Bitcoin closes February in negative territory, it will mark five consecutive monthly losses. This would be the longest losing streak since 2018.
Institutional Flows and Market Structure
Spot Bitcoin ETFs recorded $360 million in net outflows last week. Over the past four weeks, crypto ETPs have seen roughly $3.7 billion in outflows.
Harvard University reduced its Bitcoin ETF holdings by 21% while building an $87 million position in Ether. This reflects selective rotation among institutional investors rather than broad market expansion.
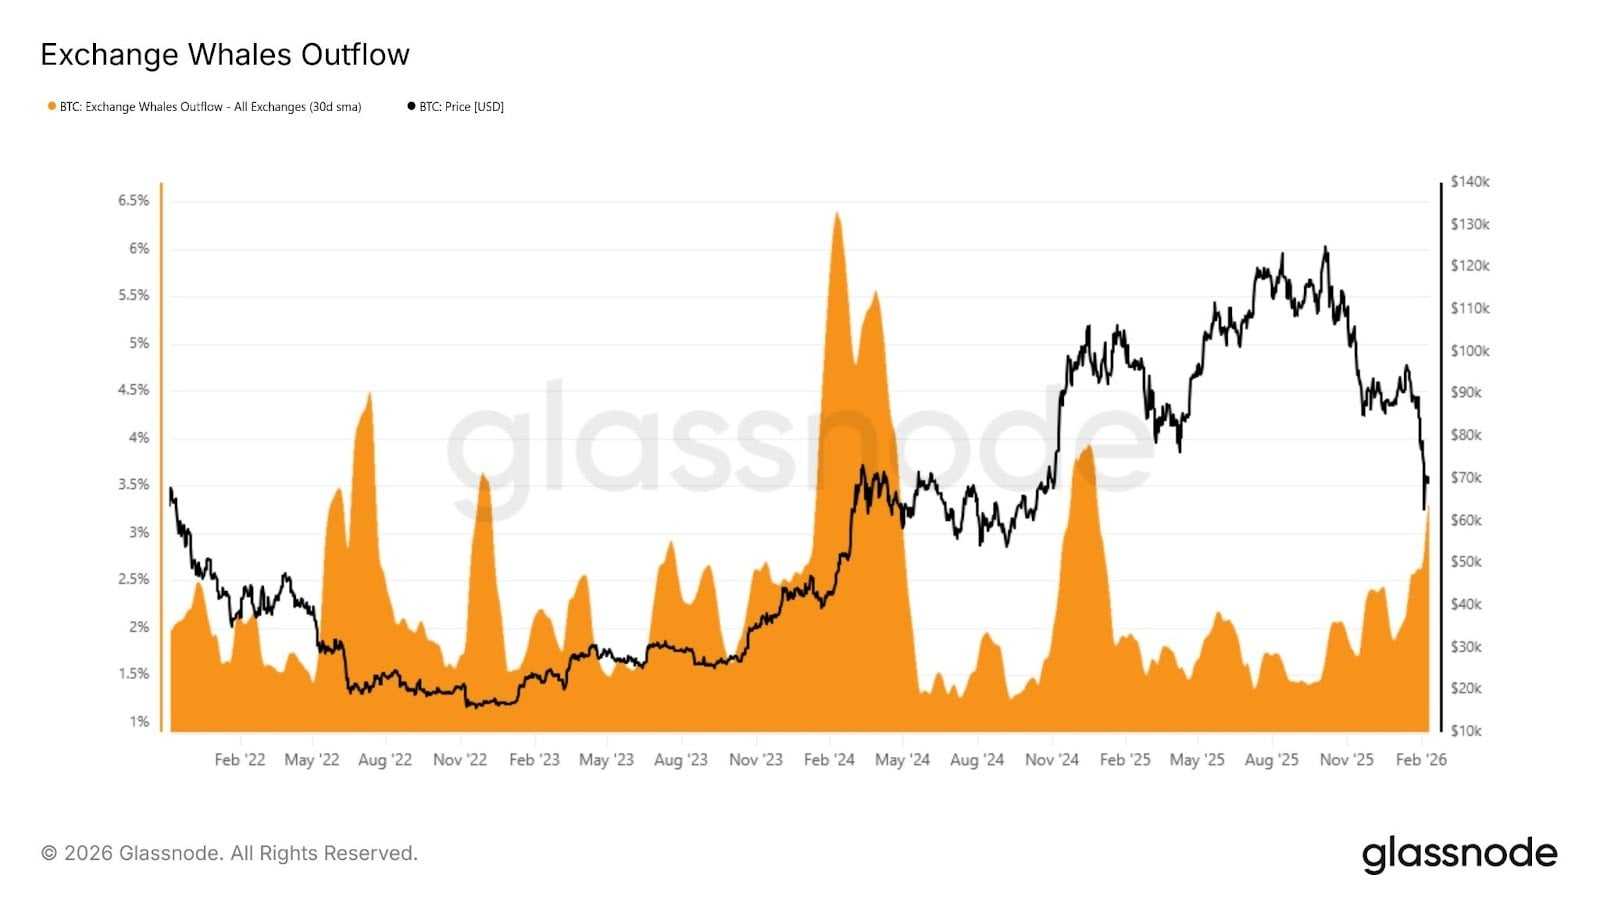
Despite the negative flows, onchain data shows some positive signs. Exchange outflows to large entities have increased, with the 30-day moving average rising to 3.2% since Bitcoin fell below $80,000. This pattern suggests larger holders are accumulating coins.
📊BEARISH: Bitcoin’s strongest holders are no longer buying the dip like before.
Dip buying from long-term holders is now as weak as during the 2022 Terra-LUNA crash.
The LTH SOPR just fell below 1 after nearly 2 years above it, showing veteran investors are realizing losses. pic.twitter.com/L9ZbSBkgNI
— Coin Bureau (@coinbureau) February 17, 2026
Bitcoin’s market value to realized value ratio is hovering near 1.1. This approaches historical undervaluation territory according to analysts.
Derivatives Markets Show Asymmetry
The derivatives market reveals crowded positioning on the short side. A 10% upward price move would liquidate approximately $4.3 billion in short positions. By comparison, a similar downward move would liquidate about $2.4 billion in long positions.
Options markets remain elevated with March implied volatility trading around 48. This represents a decline from peaks above 55 during the sharpest part of the selloff but remains well above pre-selloff levels near 40.
Bitcoin is down more than 21% year-to-date. CoinGlass data shows this puts the cryptocurrency on track for its weakest first quarter since 2015.
Strategy Inc stated it was well-positioned to survive a Bitcoin price crash to $8,000 per coin. However, the company reported a deep loss in the fourth quarter. Japanese firm Metaplanet recorded a valuation loss of about 102.2 billion yen on its Bitcoin holdings.
Timothy Misir, head of research at BRN, wrote that “the market shows fatigue, not panic.” He added that “the next impulse will likely be violent, whichever direction it resolves.”


