


 Price: Falls Below $80K Despite Record ETF Inflows – Watch these Levels")


TLDR
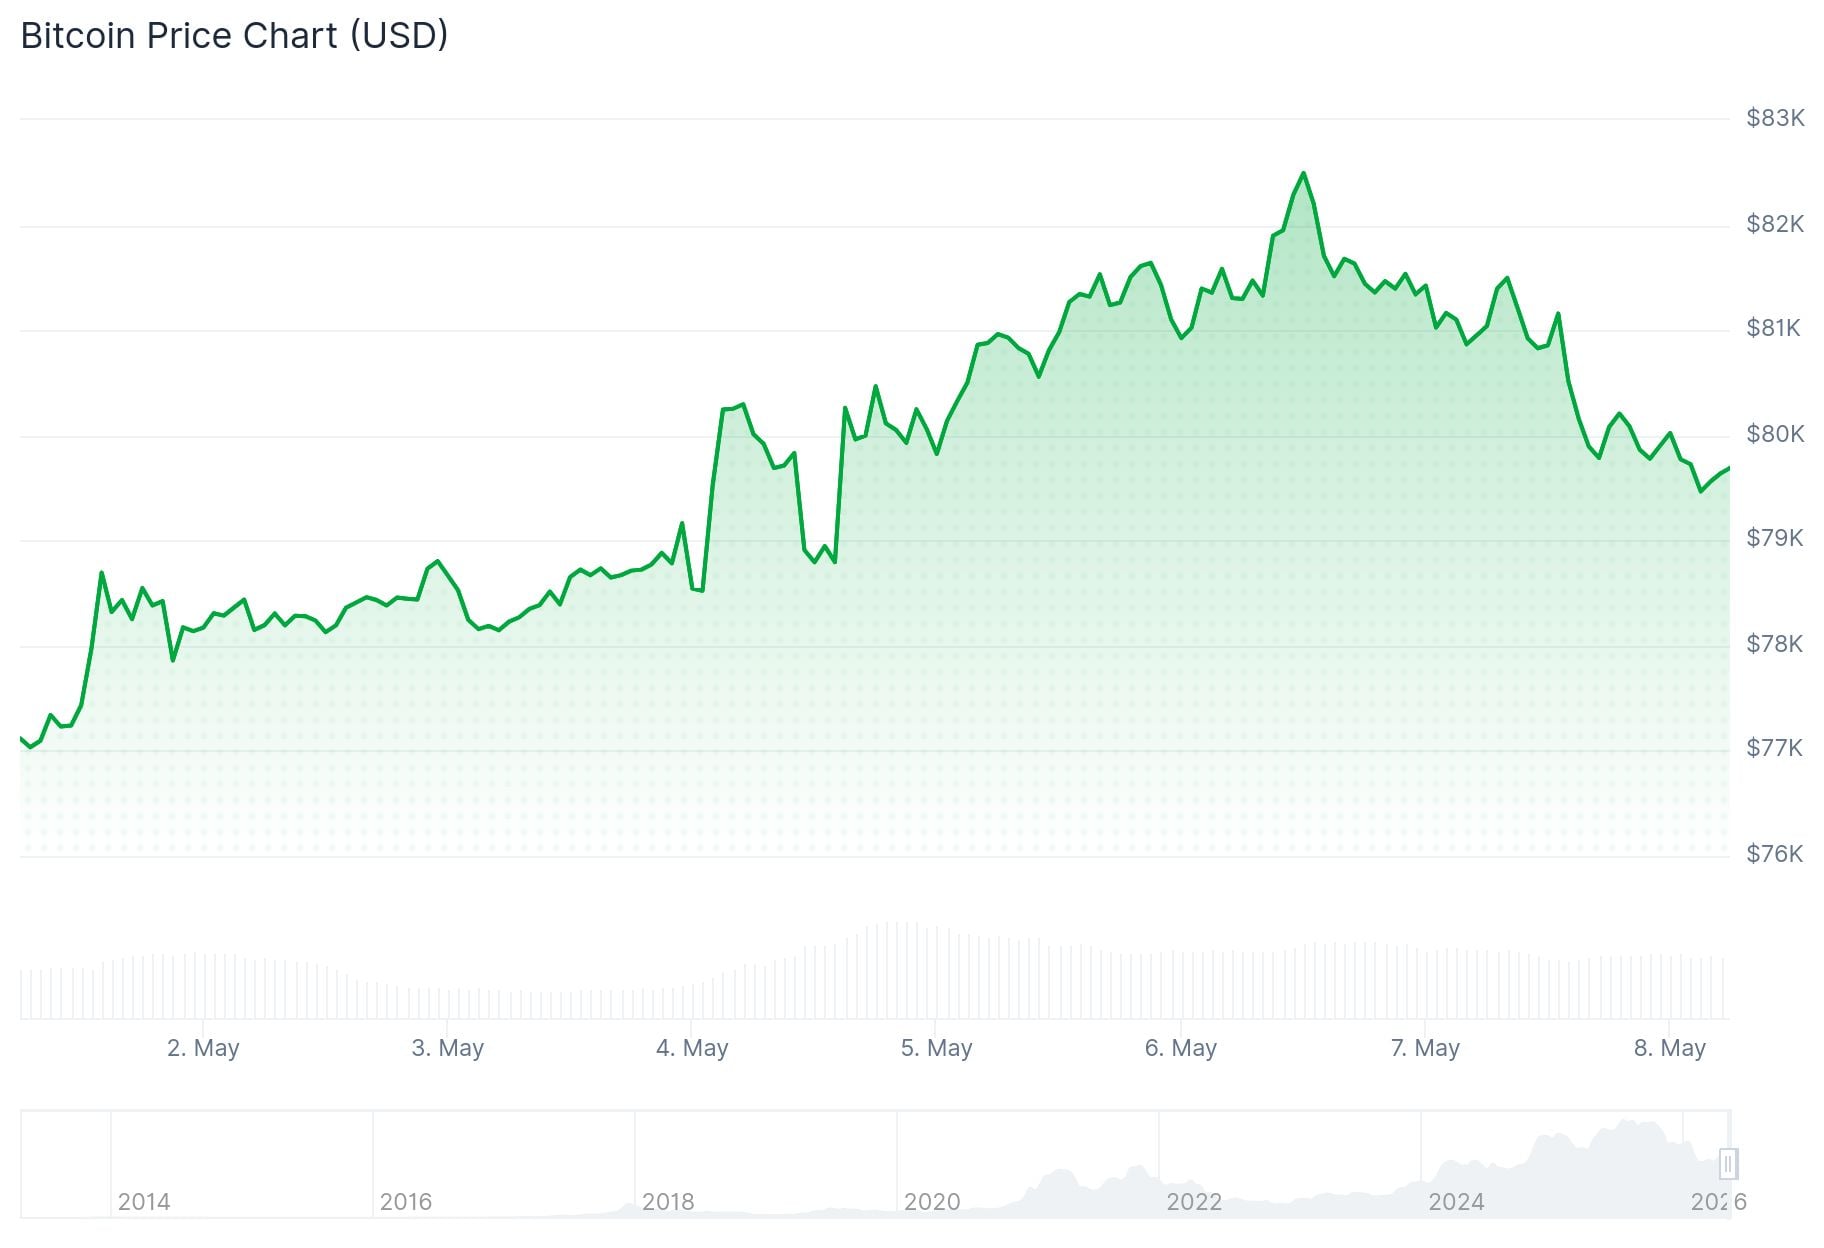
- Bitcoin dropped to $79,800 after being rejected at $82,800 resistance
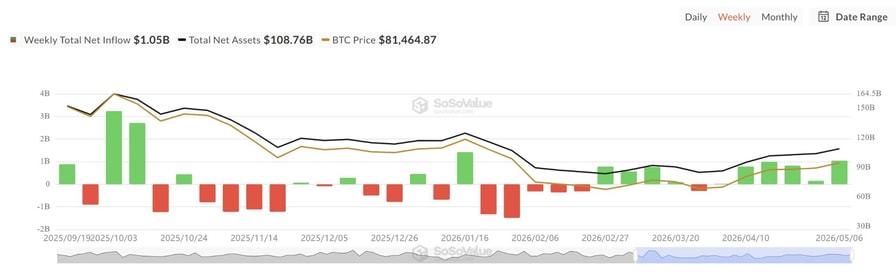
- Weekly spot BTC ETF inflows hit $1.105 billion — the highest since January
- Key support sits between $76,000–$78,000, aligning with the 200-day EMA
- Analyst Ali Charts flags $80,300 as the critical whale cost basis level to watch
- Glassnode identifies $85,200 as the next major resistance ceiling
Bitcoin fell below $80,000 on Thursday after hitting resistance at $82,800, dropping to a low of $79,800. The move came despite a strong week of ETF inflows that surpassed $1 billion for the first time since January.
Bearish divergences appeared on the one-hour and four-hour RSI charts, signaling fading buying momentum. A bearish divergence forms when price makes higher highs while the RSI moves lower — a sign that a rally may be running out of steam.
Crypto trader Jelle pointed to the 200-day moving average and EMA cluster as acting as resistance, and identified $78,000 as the first major support area. Trader Killa XBT flagged a deeper support zone between $76,300 and $74,700 if selling pressure continues.
The weekly open at $78,500 is the key short-term level bulls are defending. Below that, the daily fair value gap between $76,000 and $78,000 aligns with the 200-day EMA and represents a likely retest zone.
The $80,300 Whale Level
Analyst Ali Charts highlighted $80,300 as the most critical level to watch right now. That figure represents the average cost basis of new whales — entities that bought Bitcoin in the last 155 days.
This is the most important resistance level for Bitcoin!
The average cost basis of new whales (entities that bought in the last 155 days) is currently sitting at $80,300.
When $BTC trades below this average cost basis, these whales are holding at a loss. Yesterday, Bitcoin… pic.twitter.com/3foS24muYG
— Ali Charts (@alicharts) May 8, 2026
When Bitcoin trades below $80,300, those whales are sitting at a loss. Bitcoin briefly pushed to $82,800 before falling back under this level. If it stays below $80,300, those whales may sell to break even, adding more downside pressure.

Spot Bitcoin ETFs recorded five straight days of net inflows as of Wednesday, totaling $1.69 billion — the longest inflow streak since July 2025. Wednesday alone brought in $46.3 million.
Glassnode reported that Bitcoin has cleared two key onchain levels: the True Market Mean at $78,200 and the Short-Term Holder Cost Basis at $79,100. Trading above both puts most active market participants back in profit.
ETF Demand and the Road to $85,200
Swissblock data shows the Bitcoin Risk Index has reset near zero, with ETF net flows turning positive at roughly 3,000 BTC. According to Swissblock, “ETF demand is absorbing selling pressure. This remains a flow-driven breakout.”
Santiment data showed Bitcoin’s holder count dropped by 245,000 wallets in five days — the fastest decline in nearly two years. Santiment noted this mirrors a June–July 2024 pattern where over 964,000 wallets exited before a major bull run followed.
👋 BREAKING: Bitcoin is seeing its amount of holders decline at the fastest rate in nearly 2 years, likely due to retail traders taking profit. Crypto’s top market cap has shrunk by 245K wallets in 5 days, the most since the summer of 2024.
Capitulation is one of the key… pic.twitter.com/D7rNoQc4F0
— Santiment Intelligence (@SantimentData) May 7, 2026
Perpetual futures funding rates remain negative despite a 26% recovery from February lows, suggesting short sellers are still active. Glassnode noted long-term holders are realizing around $180 million per day in profit — measured, not aggressive.
Glassnode’s next target is the Active Realized Price at $85,200, which tracks the cost basis of all non-dormant supply. That is where overhead selling pressure is expected to increase.
Bitcoin was trading just under $80,000 during U.S. market hours Thursday. Glassnode stated a break above $85,200, backed by continued spot demand, is needed to confirm the recovery has structural legs.


