


 Price: Morning Star Pattern Forms as Analysts Eye $85K Target for May")


TLDR
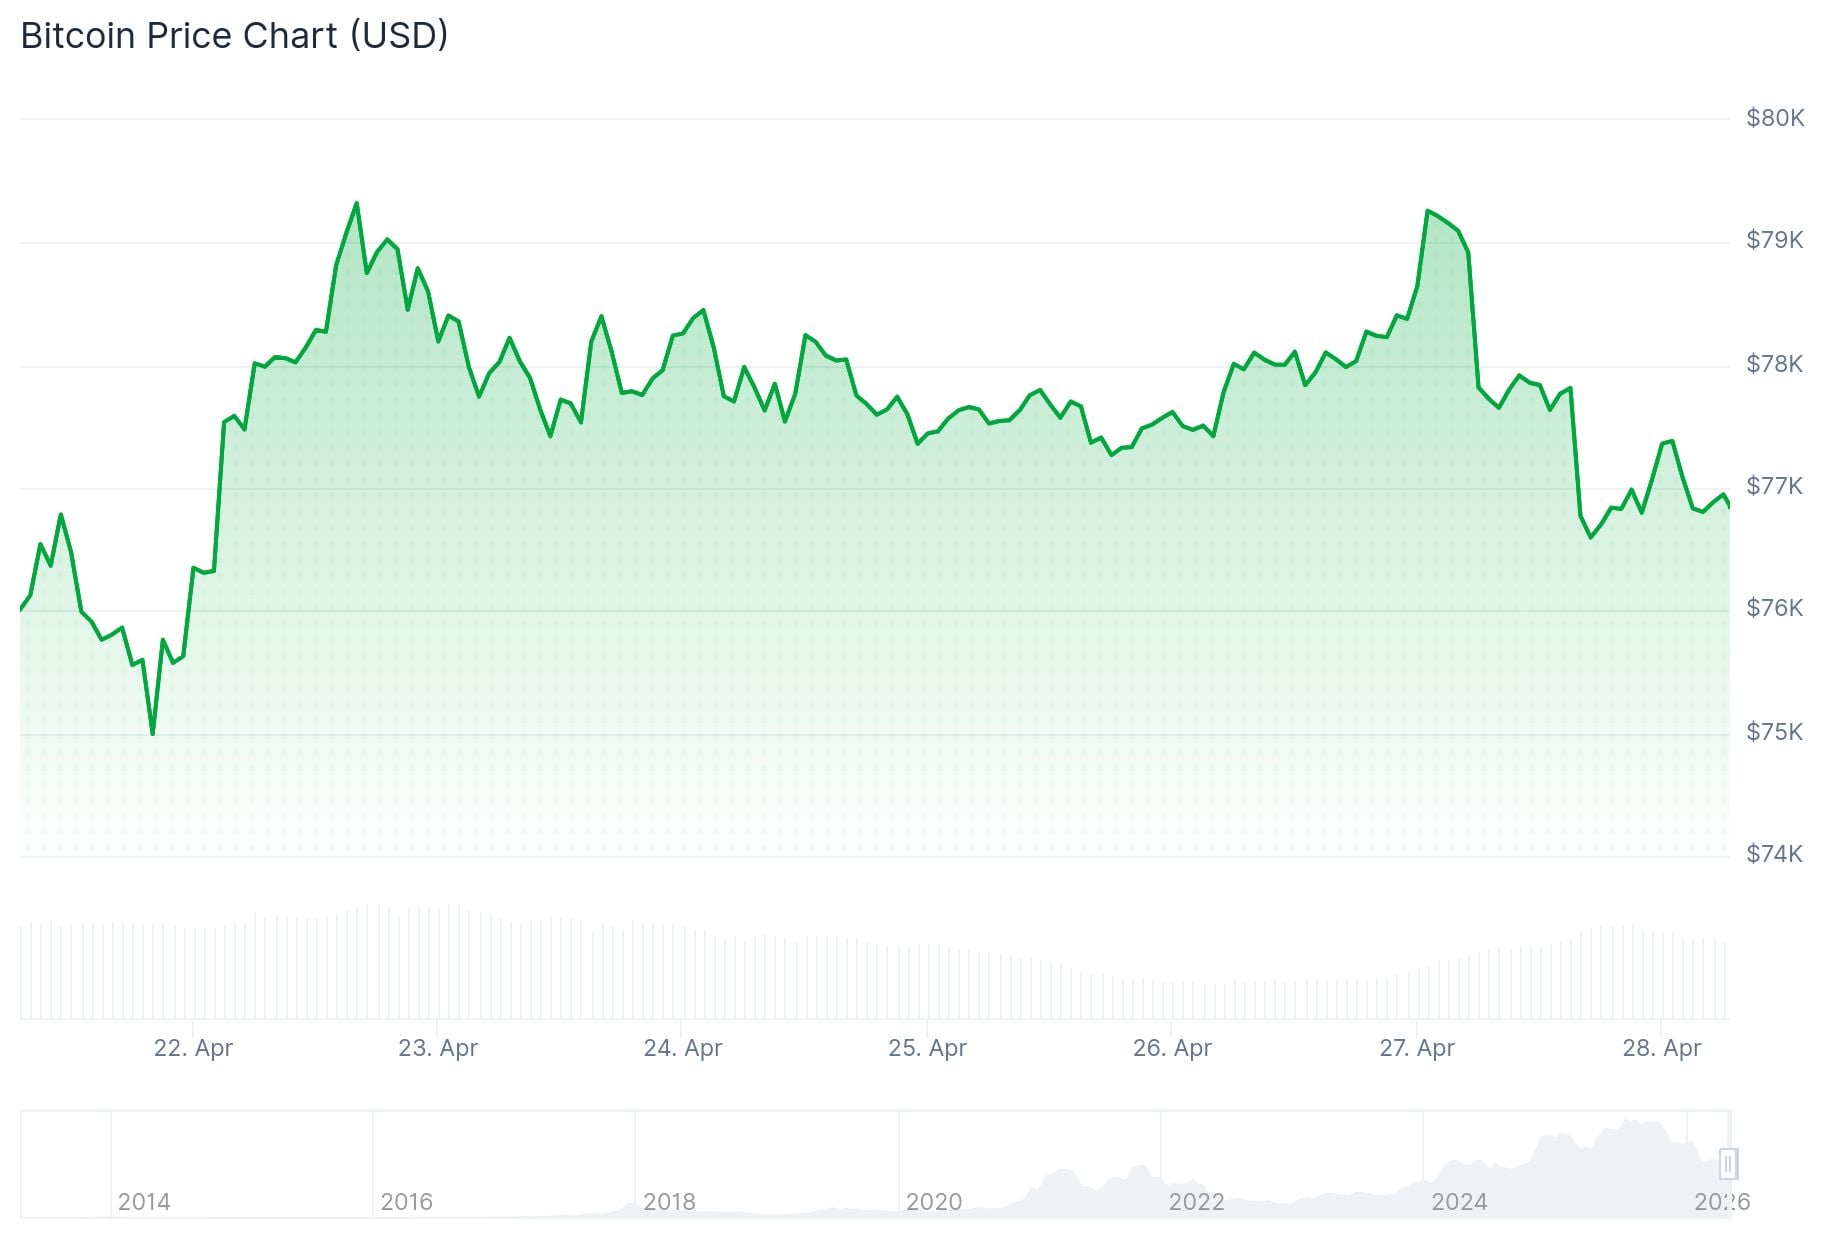
- Bitcoin is trading near $77,000, down about 3%, as traders wait for key U.S. economic data and a Fed rate decision
- Oil prices above $100 a barrel are complicating inflation, reducing chances of near-term Fed rate cuts
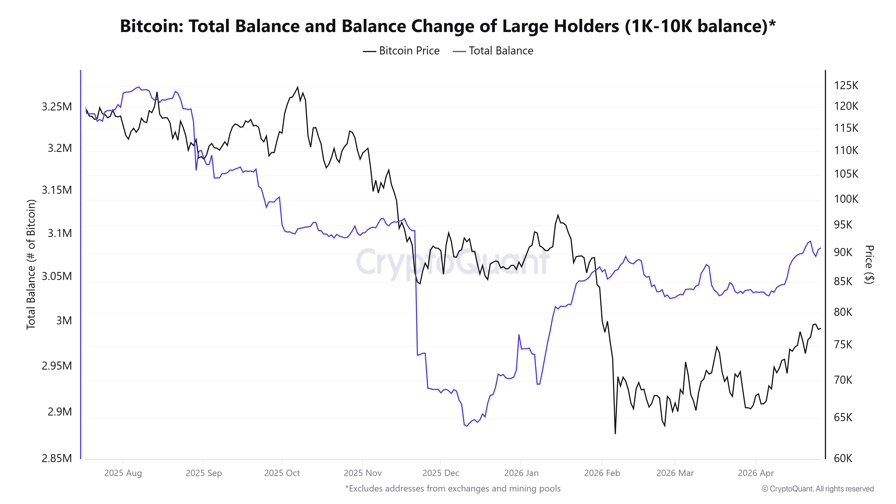
- BTC whales holding 1,000–10,000 BTC have accumulated around 240,000 BTC since December, reaching a five-month high
- A potential AI demand slowdown, flagged by OpenAI missing revenue targets, could reduce miner selling of BTC over time
- Analyst targets range from a short-term liquidity sweep near $73,700 to upside targets of $85,000–$88,000 for May
Bitcoin is trading near $77,000, down roughly 3% in Asian morning trading. The drop reflects caution ahead of a packed week of U.S. economic data rather than a major shift in market sentiment.
Singapore-based market maker Enflux said traders are holding back ahead of Wednesday’s Federal Reserve rate decision. Key data releases this week include GDP, PCE inflation, and the Employment Cost Index.
Oil prices remain the biggest obstacle. Brent crude is still above $100 a barrel, keeping inflation elevated and making it harder for the Fed to signal rate cuts.
Polymarket bettors currently give a 95% chance of no rate change at the June meeting. This has created uncertainty across risk assets, including crypto.
Bitcoin is sitting about 4% below its short-term holder cost basis of around $80,700. That level is often seen as a gauge of buyer conviction in the market.
Enflux expects BTC to trade cautiously until Thursday’s data releases, with any sharp moves more likely tied to macro prints than to the Fed statement itself.
Whale and Institutional Accumulation
On the demand side, large holders are quietly building positions. Wallets holding between 1,000 and 10,000 BTC have added around 240,000 BTC since December, bringing total holdings to 3.09 million BTC — a level last seen in November 2025.

Long-term holders have also kept selling low. Only 42,100 BTC was distributed over the past 30 days, one of the lowest figures recorded in 2026. Institutional investors added around 92,900 BTC in the past month, according to Bitwise’s Crypto Market Compass report.
Technical Levels to Watch
On the four-hour chart, Bitcoin has formed a potential double top near $79,400 after two rejections last week. Short-term price action could rotate toward liquidity zones at $74,700 and $73,700.
MN Capital founder Michaël van de Poppe says upside targets of $85,000–$88,000 remain valid for May, as long as key support holds.
Morning Star candlestick patterns signal that sellers are exhausted and buyers are taking back control. This three-period formation represents the transition from fear to indecision, and finally, to aggressive conviction.
In the last three years, Bitcoin $BTC has formed three… pic.twitter.com/a7V2zMkzkv
— Ali Charts (@alicharts) April 27, 2026
Analyst Ali Charts noted on social media that Bitcoin is forming a Morning Star candlestick pattern on the monthly timeframe — a formation that has historically marked macro turning points for BTC. He pointed to over $1 billion in net taker volume on Binance as support for the move, with $73,000 as the key level to hold.
The next test for BTC is cleanly breaking the cost basis of recent investors (79k).
I give it 30% odds on doing this on this attempt. After that, if BTC manages to hold this price level above 65k and not break down, then the chances of a structural bottom increases… https://t.co/03TZWYF0NM
— Willy Woo (@willywoo) April 28, 2026
Analyst Willy Woo gave a 30% chance of BTC cleanly breaking the $79,000 cost basis of recent investors on this attempt, adding that the next three to six weeks will be telling for whether a structural bottom is forming.
The most recent data shows funding rates at -7% on a 30-day basis, one of the lowest readings on record — a condition that could set up a short squeeze if BTC moves above $80,000.


