


 Price: Peace Talk Hopes and Bullish Metrics Push BTC Back Above $79K")


TLDR
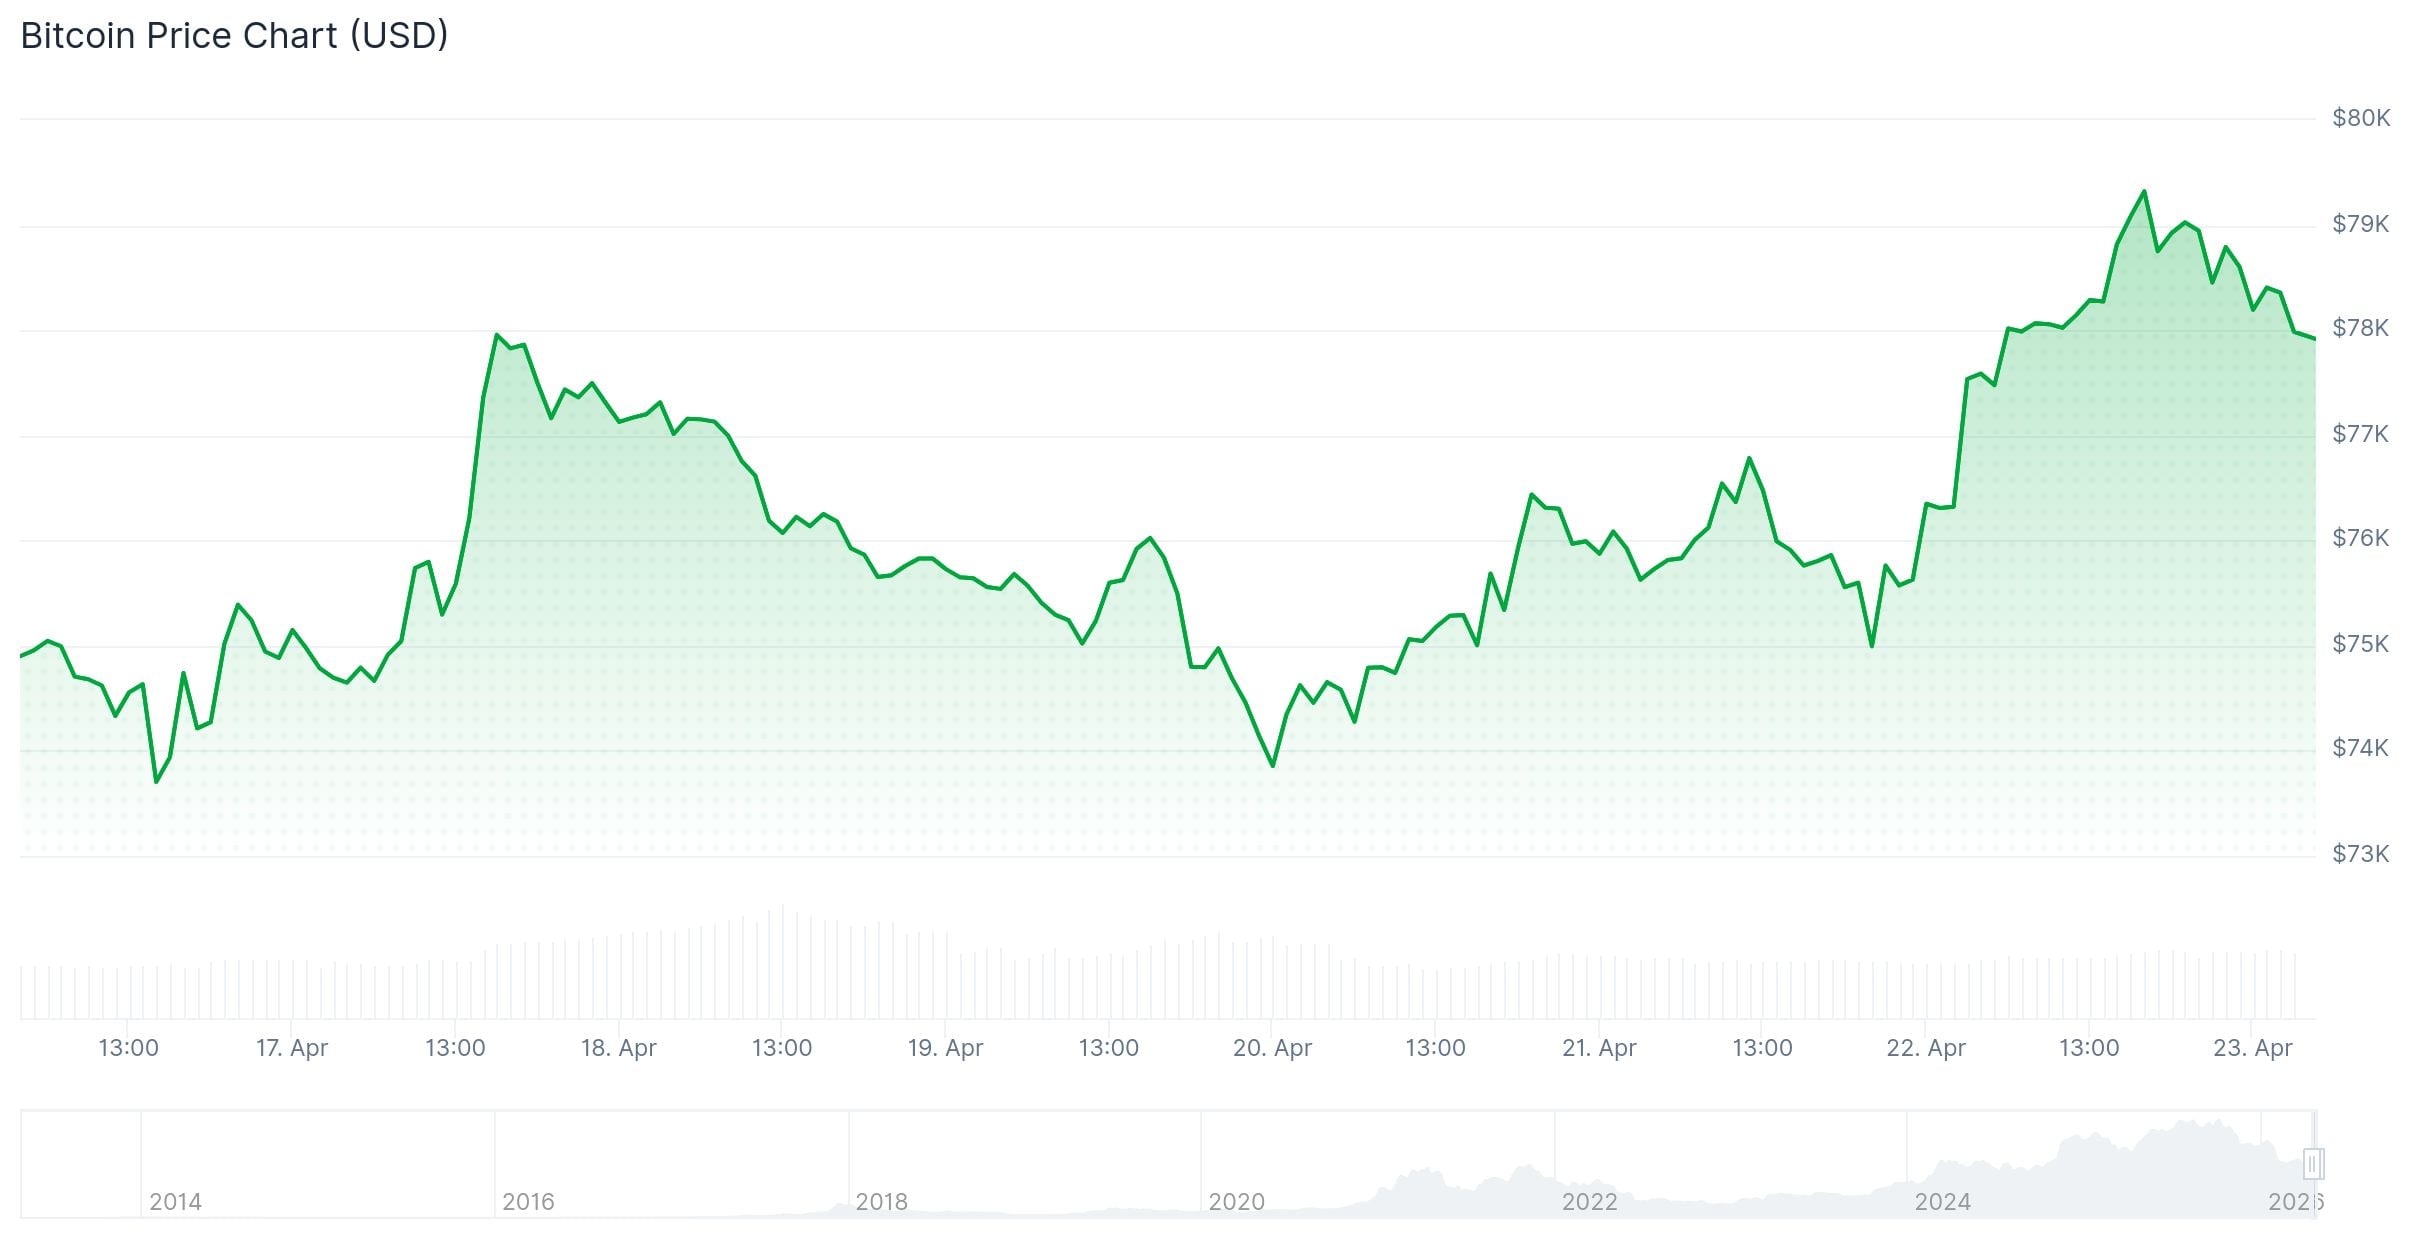
- Bitcoin hit a monthly high of $79,472 on Wednesday, its best 28-day return since April 2025
- The Bitcoin positioning index rose to 4.5 from -10.9 in February, signaling improving sentiment
- Open interest jumped 6.7% in 24 hours to 260,000 BTC, with futures OI surging nearly 9% to $62B
- Trump’s comments on possible US-Iran peace talks boosted risk assets including crypto
- Key resistance sits at $83,000–$88,000; support holds at $72,000–$75,000
Bitcoin reached a monthly high of $79,472 on Wednesday, its strongest 28-day performance since April 2025. The price climbed over 4% in 24 hours, pushing toward the $80,000 level as multiple on-chain and derivatives metrics turned positive.
Bitcoin researcher Axel Adler Jr. noted the Bitcoin positioning index rose to 4.5, up from -10.9 in February. This index tracks net taker flow, open interest trends, funding rates, and exchange balances in a single reading.
Open interest rose 6.7% over 24 hours to 260,000 BTC. The 30-day change in open interest stands at +14.5%, with 23 of the past 30 sessions closing positive.
BTC futures open interest also surged nearly 9% to above $62 billion. Open interest on CME jumped 0.50% and nearly 2% on Binance following Trump’s peace talk comments.
President Donald Trump said US-Iran peace talks could resume as soon as Friday, according to the New York Post. This followed his decision to extend a ceasefire with Iran indefinitely.
BREAKING: Iran currently has "no plans" to negotiate with the US on Friday, per Tasnim.
This morning, President Trump said he was expecting talks to begin as soon as Friday.
— The Kobeissi Letter (@KobeissiLetter) April 22, 2026
US stocks also climbed around 1% on Wednesday, with the S&P 500, Nasdaq 100, and Dow Jones all gaining. Risk assets broadly responded to the geopolitical news.

Iran has not confirmed participation in the talks. Iranian forces seized two cargo ships near the Strait of Hormuz hours after the ceasefire extension, adding uncertainty.
Key Price Levels to Watch
Bitcoin has broken above a descending trendline from its October 2025 peak near $126,000 and reclaimed the 100-day exponential moving average. The $81,000 level is the first test zone, with a fair-value gap suggesting a liquidity imbalance.
The $83,000–$85,000 range is a profit-taking zone for short-term holders. Above that, the $88,000–$91,000 zone marks a major supply area where large volumes previously changed hands.
The realized price of three-to-six-month holders sits at $91,600, reinforcing that range as a key decision point.
Bitcoin $BTC forms a bullish reversal pattern!
Bitcoin is currently developing a Morning Star candlestick pattern on the monthly chart. This is essentially a three-day sequence that signals the sellers are exhausted, and the buyers are taking back control.
This is one of my… pic.twitter.com/LleaZCwzpE
— Ali Charts (@alicharts) April 22, 2026
Analyst Ali Charts posted about Bitcoin forming a Morning Star candlestick pattern on the monthly chart — a three-candle setup he describes as a signal that sellers are exhausted and buyers are taking control. He noted that historically, price tends to pull back around 8% on average before the main rally begins.
Support and Downside Risk
Analyst Crazzyblockk identified $72,000–$75,000 as a strong support floor, backed by realized price clusters from mid-term holders. A break below that band could push more supply into loss territory.

Grayscale Research previously signaled Bitcoin likely bottomed in the $65,000–$70,000 range. The Bitcoin Bull Index turned neutral for the first time in six months, per CryptoQuant research head Julio Moreno.
Trading volume dropped 32% during the rebound, suggesting some caution among traders despite the price move.
BTC futures open interest on CME and Binance continued to rise as of Wednesday afternoon, reflecting active positioning in derivatives markets.


