


 Price Prediction: Hits $124K All-Time High Overtaking Google in Market Cap")


TLDR
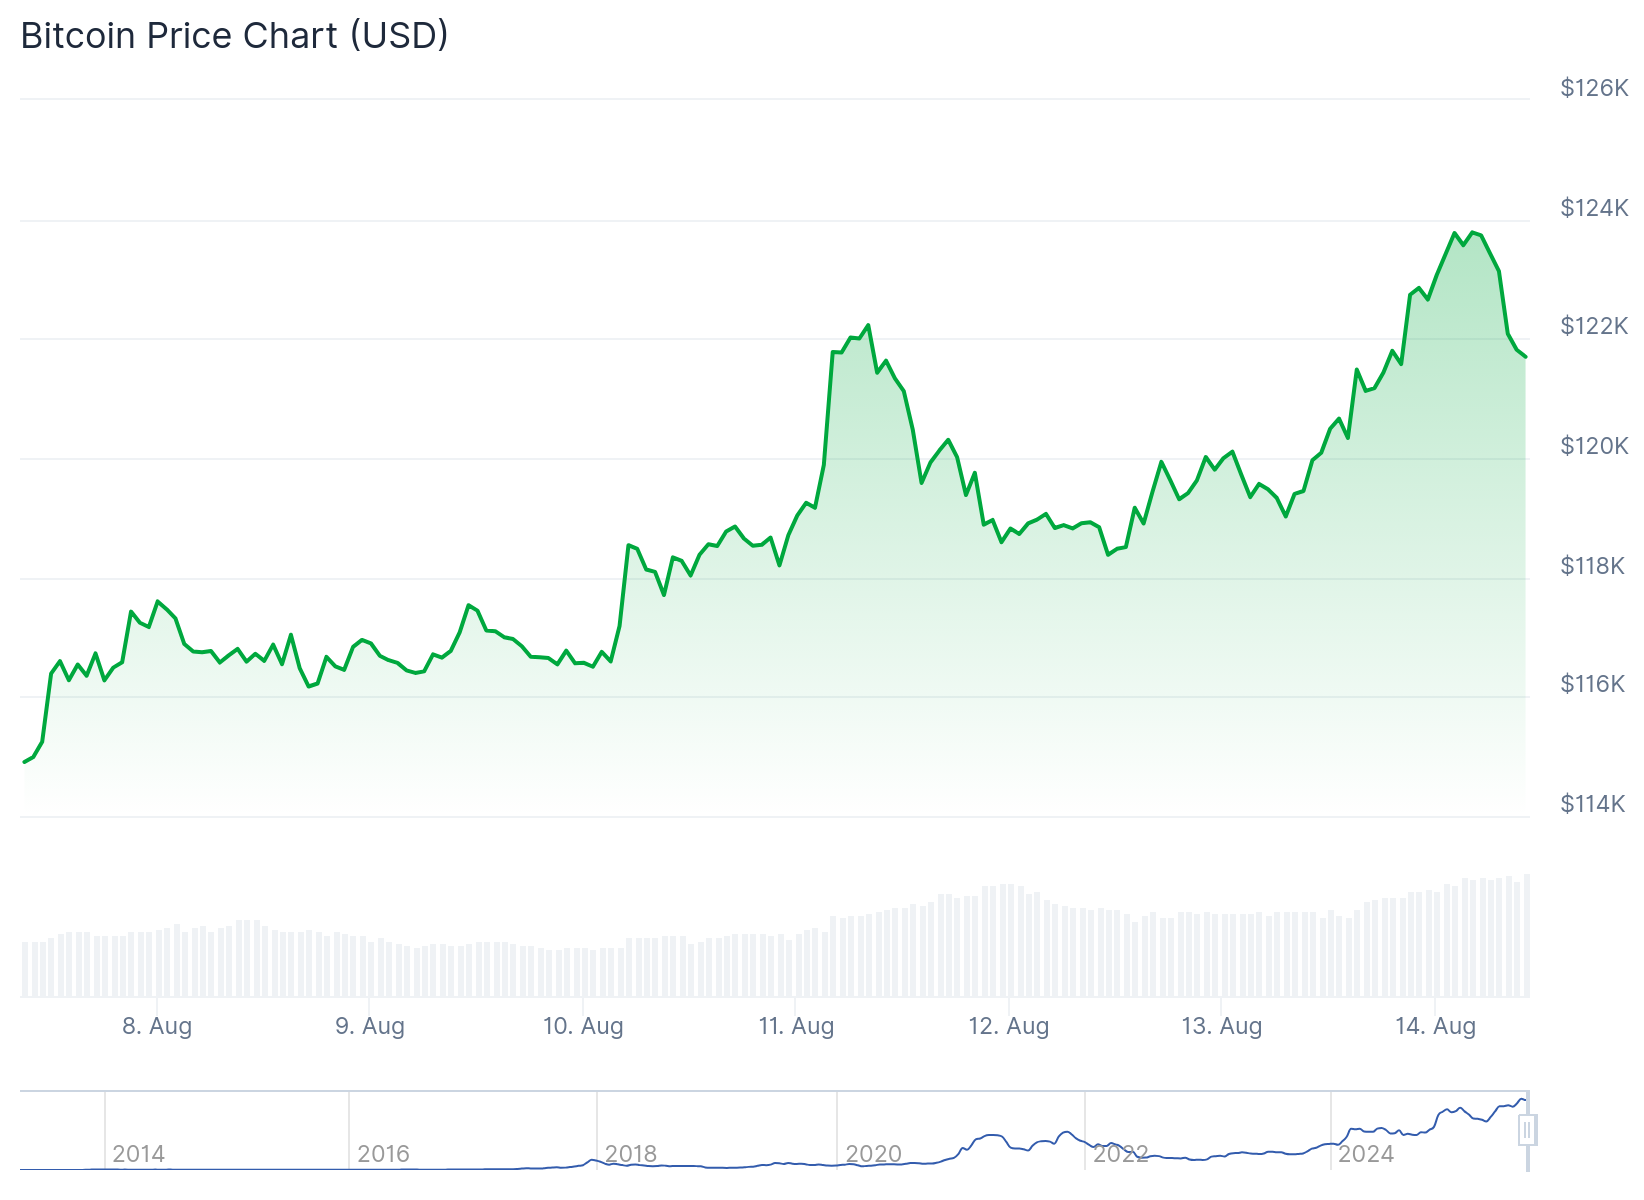
- Bitcoin reached a new all-time high above $124,000 on Wednesday, breaking its previous record of $123,205
- The cryptocurrency became the fifth-largest asset by market cap at $2.46 trillion, overtaking Google’s $2.4 trillion valuation
- US inflation data showed CPI unchanged at 2.7% year-over-year, boosting bets for a September Fed rate cut to 93.9%
- Bitcoin and Ethereum ETFs saw strong inflows with BTC ETF receiving $65.9 million and ETH ETF hitting $523.9 million on Tuesday
- Short liquidations totaling nearly $2 billion are at risk if Bitcoin pushes through the $122,800 to $125,500 range
Bitcoin price surged past its previous record on Wednesday, climbing above $124,000 during early Asia trading on Thursday. The move topped the July 14 high of $123,205 before seeing slight profit taking.
The cryptocurrency mirrored a rally in U.S. equities as the S&P 500 logged its second consecutive record close at 6,457. Both markets fed off the same bullish macro backdrop.
Bitcoin’s ascent came one day after July US Consumer Price Index data showed inflation holding at 2.7% year-over-year. This was unchanged from June and below the forecast 2.8%.
The overall CPI increased 0.2% versus a 0.3% increase in June. Following the report’s release, the CME FedWatch tool showed market odds of a Federal Reserve rate cut in September rising to 93.9%.
Long-time crypto investors say Fed rate cuts and a shift away from quantitative tightening are historically beneficial to Bitcoin’s price action. Many also anticipate President Donald Trump’s economic agenda outlined in the One Big Beautiful Bill to lead to increased spending and risk seeking in financial markets.
Market Capitalization Milestone
Bitcoin became the fifth-largest asset by market capitalization across all assets, crossing Google’s $2.4 trillion valuation. The cryptocurrency’s market cap climbed to $2.46 trillion.
The milestone reflects a year-long build in bullish sentiment. This has been fueled by a friendlier regulatory backdrop under President Trump and rapid adoption of corporate treasury strategies centered on Bitcoin accumulation.

Michael Saylor’s MicroStrategy pioneered the playbook of stockpiling BTC as a balance sheet asset. This move is now mirrored by smaller public companies and increasingly by Ether proponents.
Ether’s market cap reached nearly $575 billion according to CoinGecko. Together, Bitcoin and Ether dominate roughly 70% of all crypto trading activity.
The total crypto market cap currently stands at a record $4.15 trillion.
Bitcoin Price Prediction
Inflows to Bitcoin and Ether spot ETFs have caught traders’ attention and added to bullish sentiment throughout the market. Farside Investors data shows BTC ETF netflows reached $65.9 million on Tuesday.

The ETH instrument saw $523.9 million in share purchases on Tuesday. On the same day, the ETH ETF saw its first $1 billion inflow.
While Bitcoin ETF netflows have slowed, the instrument still saw $1.02 billion in inflows since Friday. The cumulative impact of ETH’s success is clearly boosting sentiment across Bitcoin and altcoin prices.

Liquidation heatmap data from Hyblock shows Bitcoin pushing through a short liquidation cluster starting at $122,500. There is room for further forced closure of positions extending to $124,000.
Data from CoinGlass suggests nearly $2 billion in short positions are at risk of liquidation. This could happen if traders push BTC price through the $122,800 to $125,500 liquidity cluster.
With Bitcoin price now firmly above the $120,000 resistance zone, some technical analysts are eyeing $135,000 to $138,000 as the next upside target.


