


 Price Prediction: Retail Traders Flip Ultra Bearish as BTC Tests Key Support Level")


TLDR
- Bitcoin price dropped to $112,656, its lowest level since August 3, representing an 8.5% decline from recent highs above $124,000
- Retail traders shifted from bullish to “ultra bearish” sentiment in 24 hours, marking the most negative social media sentiment since June 22
- Technical analysis shows Bitcoin broke below an ascending triangle pattern and the 50-day moving average at $115,870
- A head-and-shoulders pattern has formed with critical neckline support at $112,000
- Historical patterns suggest corrections during bull markets are normal, with similar pullbacks occurring in 2017 and 2021
Bitcoin price recently fell to $112,656 on Coinbase during late Tuesday trading. This marked the cryptocurrency’s lowest price point since August 3.
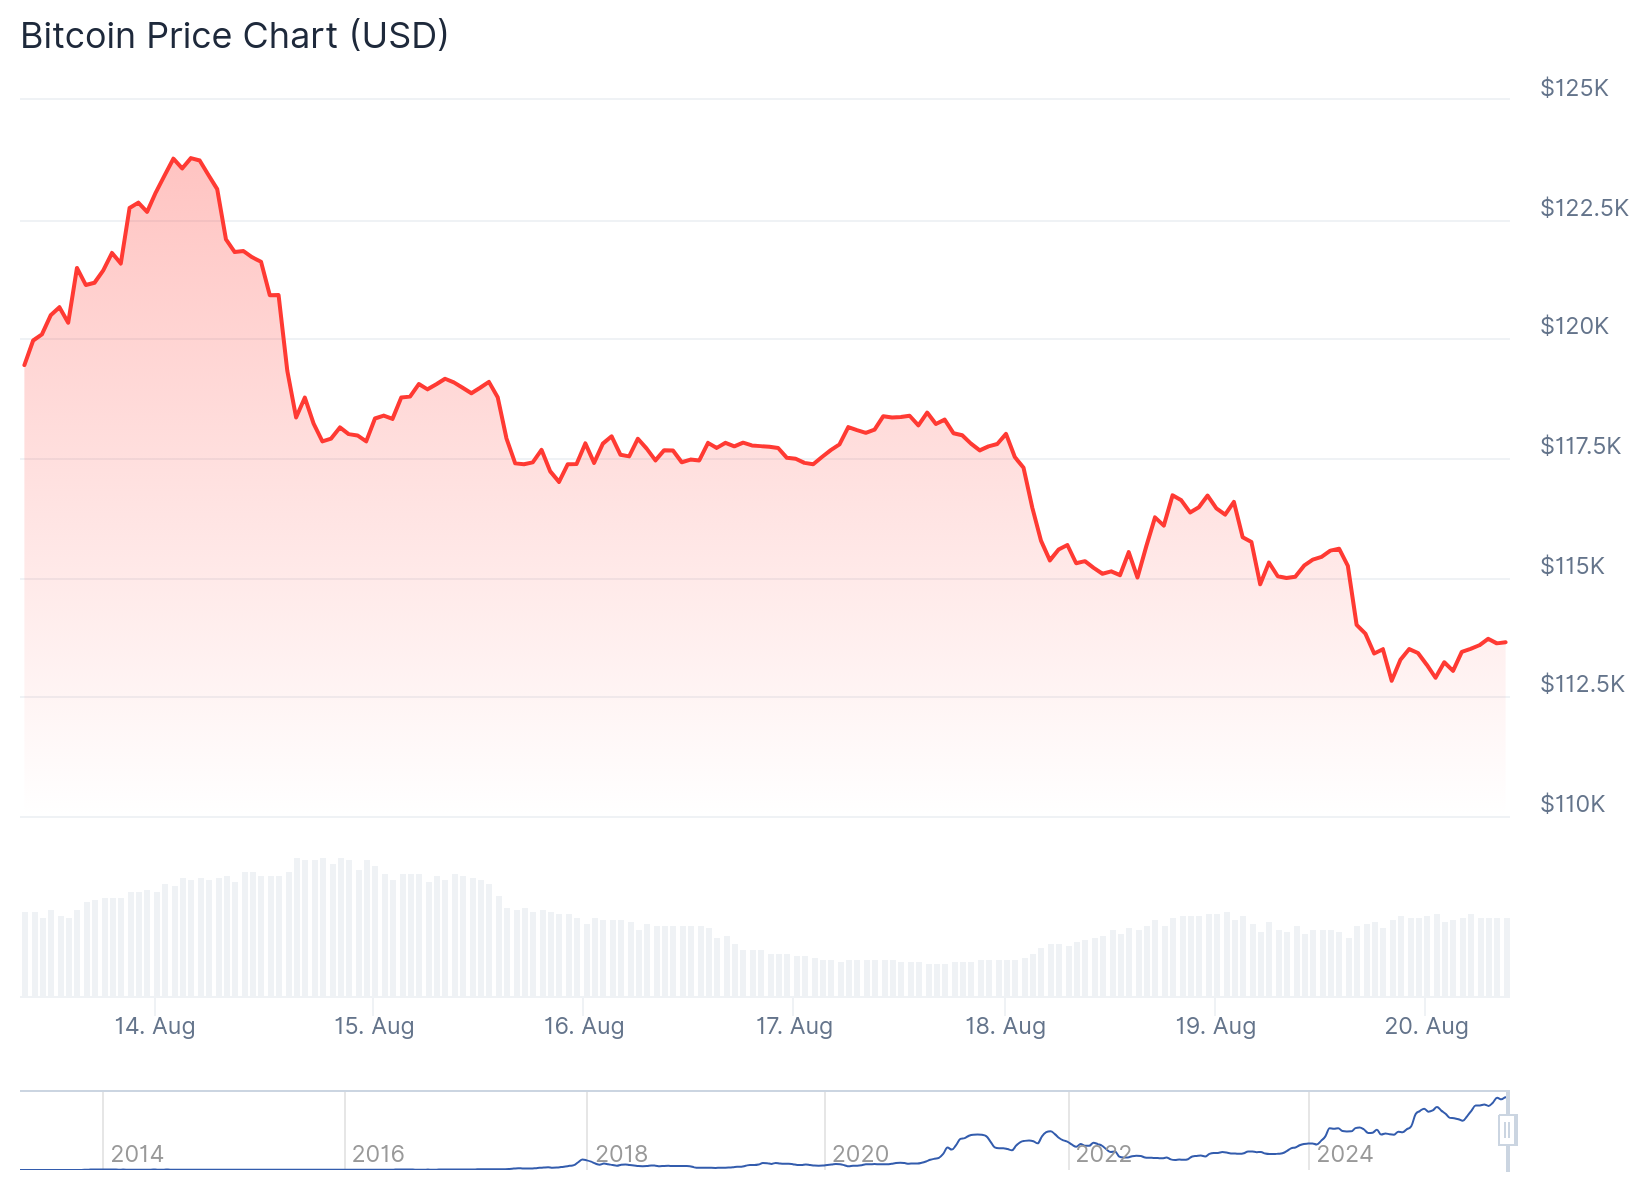
The decline represents an 8.5% retreat from Bitcoin’s all-time high of just over $124,000 reached last week. The broader crypto market has also felt pressure, with total market capitalization dropping below $4 trillion.
Blockchain analytics firm Santiment reported that retail traders completely reversed their outlook within 24 hours. The firm noted this represented the most bearish social media sentiment observed since June 22.
😨 Retail traders have done a complete 180 after Bitcoin has failed to rally and dipped below $113K. The past 24 hours have marked the most bearish sentiment seen on social media since the June 22nd fears of war caused a cascade of panic sells.
🩸 Historically, this negative… pic.twitter.com/UYKOpWoOkn
— Santiment (@santimentfeed) August 20, 2025
During that earlier period, fears of Middle Eastern conflict triggered widespread panic selling across crypto markets. Santiment analysts explained that retail traders typically react more emotionally to price movements than long-term holders.
The Bitcoin Fear and Greed Index dropped to 44 out of 100, placing it in “Fear” territory. This marks the lowest reading since late June.
Technical analysis reveals Bitcoin broke below an ascending triangle formation after weeks of consolidation. The breakdown also pushed the price below the 50-day simple moving average at $115,870.

Technical Patterns Signal Caution
The daily chart shows a developing head-and-shoulders pattern with neckline support at $112,000. Technical analysts warn that a clean break below this level could accelerate selling toward $108,000.
#Bitcoin at $113.4K after breaking its triangle. Support at $112K, resistance $116.1K–$124.4K. RSI 41, MACD bearish. Lose $112K → $108K. Hold & rebound → path to $130K. pic.twitter.com/qKVEcOg2VN
— Arslan Ali (@forex_arslan) August 19, 2025
Extended downside targets point to $105,150 if selling pressure continues. Multiple strong bearish candles have formed, resembling early stages of a three-crows pattern.
MACD indicators have turned negative while RSI sits at 41. This suggests room for further downside without reaching oversold conditions that typically trigger bounces.
Historical Context Provides Perspective
Market corrections during bull cycles follow established patterns from previous years. Similar pullbacks occurred at comparable stages in both 2017 and 2021.
we are here pic.twitter.com/HWpJ8wb9s6
— 𝗰𝘆𝗰𝗹𝗼𝗽 (@nobrainflip) August 19, 2025
During September 2017, Bitcoin corrected 36% before surging to new peaks three months later. A parallel scenario unfolded in September 2021 when Bitcoin dropped 23% before reaching fresh all-time highs.
If 2025 follows similar patterns, Bitcoin could potentially pull back to $90,000 next month. However, this would be followed by recovery to new all-time highs based on historical precedent.
Despite near-term selling pressure, institutional buying continues. Companies like Metaplanet and MicroStrategy have maintained their accumulation strategies during price dips.
For bullish scenarios, traders watch for recovery above $116,150. This could trigger a bounce toward $120,900 with potential retests of $124,450 and higher levels.
Bearish cases focus on breaks below $112,000 neckline support. Such a move could accelerate selling toward the $108,000 target zone.
The structural bullish trend remains intact according to longer-term chart analysis. Bitcoin maintains a sequence of higher lows dating back to June.
Small-bodied candles at current levels show market indecision rather than capitulation. This suggests the correction may be part of normal accumulation phases.
Current price action around $113,400 represents a critical juncture for Bitcoin’s near-term direction. The cryptocurrency trades down over 2.75% in the past 24 hours as markets digest the technical breakdown.


