


 Price: SkyBridge’s Scaramucci Calls Current Levels a Buying Opportunity")


TLDR
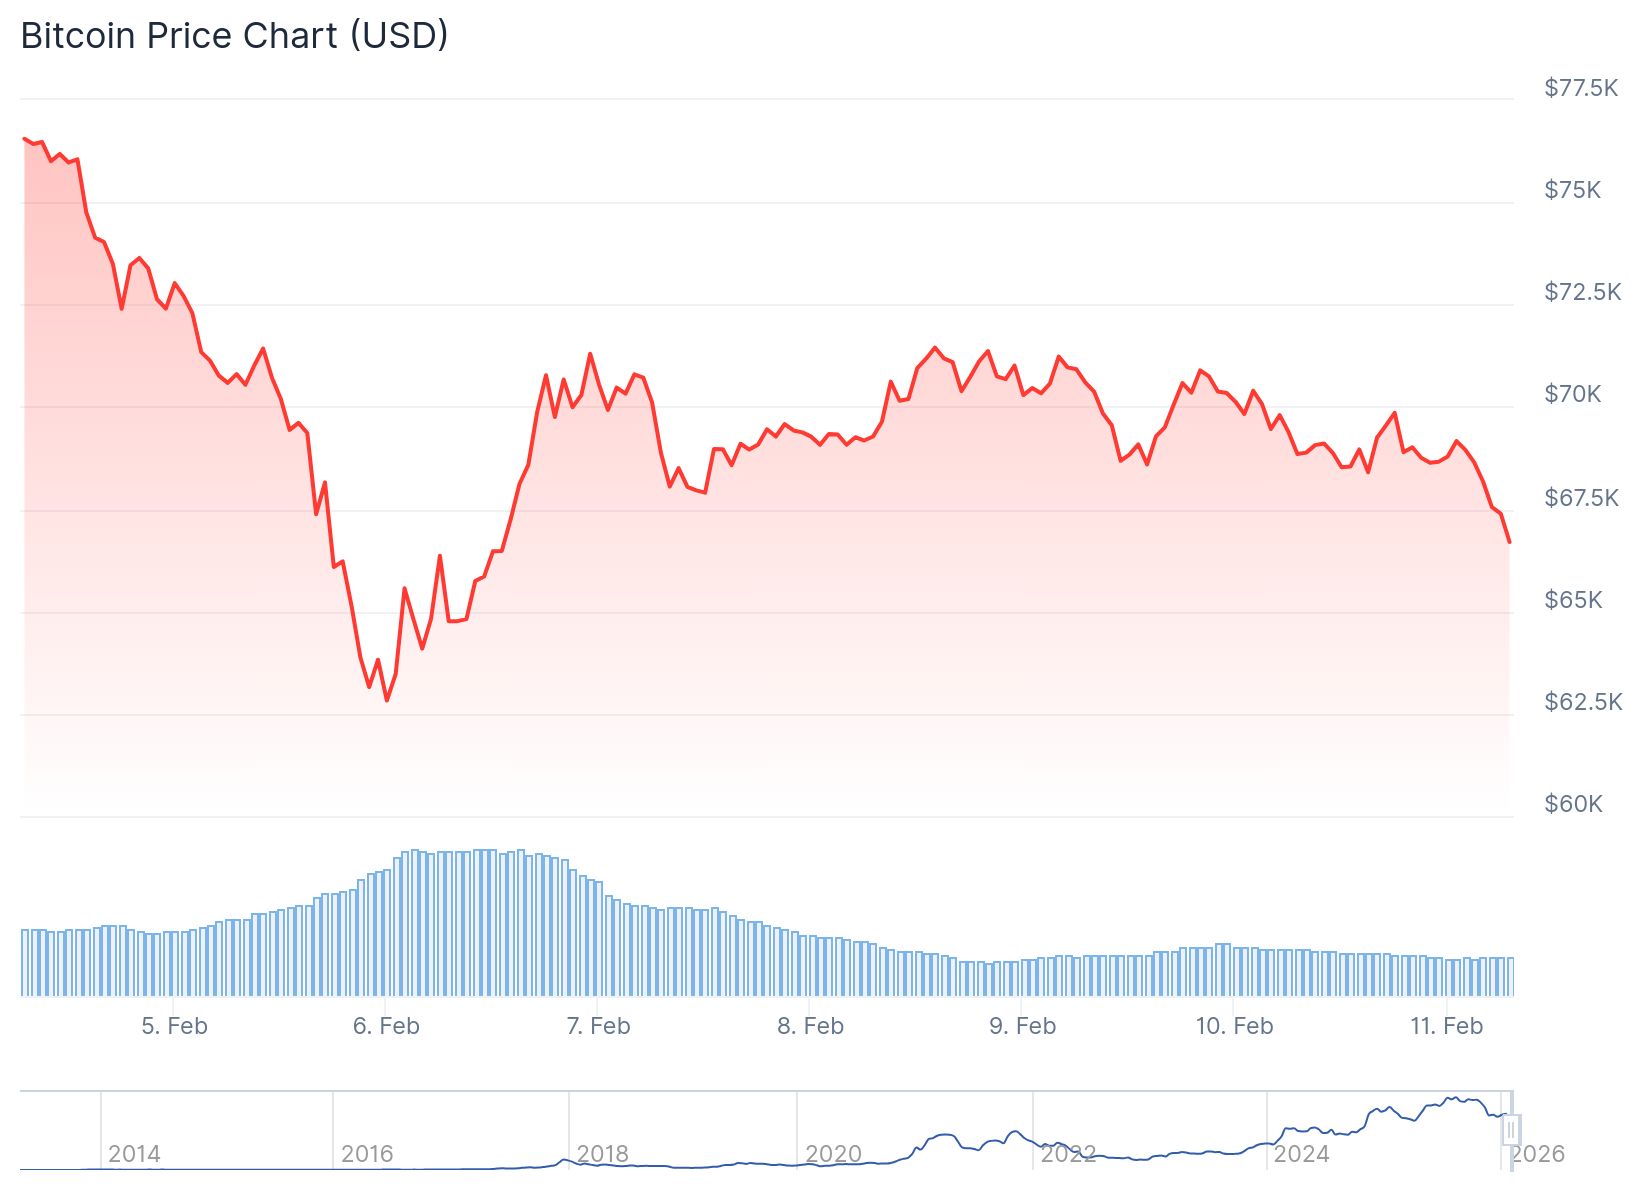
- Bitcoin dropped below $67,000 on Wednesday morning, falling 3.1% to $66,804, while Ethereum slipped 4.1% to $1,965
- Kevin Warsh’s nomination as Federal Reserve chair triggered the selloff with expectations of tighter liquidity and fewer rate cuts ahead
- Derivatives data shows much of the excess leverage has been cleared from the market with funding rates signaling deleveraged positions
- Spot Bitcoin ETFs recorded $166.56 million in net inflows on Tuesday, up from $145 million the previous day
- Multiple long-term Bitcoin valuation models suggest the recent drop to $60,000 opened up a discounted buying opportunity with potential upside of 170% to 220%
Bitcoin fell below the $67,000 level early Wednesday as cryptocurrency markets responded to a more hawkish outlook on U.S. monetary policy. The world’s largest cryptocurrency dropped 3.1% over 24 hours to $66,804 as of 1:13 a.m. ET Wednesday.
Ethereum declined 4.1% to $1,965 during the same period. Other major cryptocurrencies also moved lower, with XRP falling 4.3% and BNB sliding 4.5%.
The selloff came after Kevin Warsh’s nomination as Federal Reserve chair. Andri Fauzan Adziima, research lead at Bitrue, said the move signals tighter liquidity and fewer rate cuts ahead. Traders are now watching for stabilization around the $60,000 to $65,000 support level.
Vincent Liu, CIO of Kronos Research, said derivatives data shows much of the excess leverage has been removed from the market. Bitcoin and Ethereum dipped as exchanges saw deep deleveraging. Funding rates indicate most leveraged positions have been cleared out.
Liu added that institutional capital appears to be waiting on the sidelines. Investors are looking for clearer catalysts such as sustained exchange-traded fund momentum or fresh macro signals before re-entering in larger size.
ETF Flows Continue
On Tuesday, spot Bitcoin ETFs recorded $166.56 million in net inflows. This was up from inflows of $145 million the previous day. Spot Ethereum ETFs saw more modest inflows of $13.82 million, compared to $57 million in inflows on Monday.
On Feb. 10 (U.S. Eastern Time), spot Bitcoin ETFs recorded a net inflow of $167 million, marking the third consecutive day of net inflows. Spot Ethereum ETFs saw total net inflows of $13.82 million, led by Grayscale’s Ethereum Mini Trust ETF (ETH), which posted $13.32 million in… pic.twitter.com/XUB7xiocWb
— Wu Blockchain (@WuBlockchain) February 11, 2026

SkyBridge Capital founder Anthony Scaramucci said Wednesday he is buying Bitcoin during the market downturn. Scaramucci noted that SkyBridge has been purchasing Bitcoin at various price points. These included around $84,000, $63,000 and in the current lower range.
He described buying Bitcoin in a downward-trending market as akin to catching a falling knife. Bitcoin recently crashed to nearly $60,000 after hitting a peak of over $126,000 in October.
Asian equities moved higher on Wednesday morning. South Korea’s Kospi rose 1.24% by midday. Hong Kong’s Hang Seng index edged up 0.42%. Japanese markets were closed for a public holiday.
U.S. stocks showed varied results on Tuesday. The S&P 500 declined 0.33% while the Nasdaq Composite slipped 0.59%. The Dow Jones Industrial Average rose modestly by 0.1%.
Valuation Models Show Potential
Multiple long-term Bitcoin valuation models suggest the drop to $60,000 opened up a discounted buying opportunity. Bitcoin’s realized price sits near $55,000, while the shifted realized price is about $42,000.
Power Law Quantile model, right now the quantile is 0.14.
Support is strong around 0.05. pic.twitter.com/X2MDWBn9Wa— Giovanni's BTC_POWER_LAW (@Giovann35084111) February 7, 2026
Historical data shows rallies following the retest of these zones delivered returns. While returns have diminished over time, the structure implies upside potential of 170% to 220%. This aligns with targets above $150,000 in the next period of growth.
The updated power law quantile model places Bitcoin near the 14th percentile of its long-term price corridor. This suggests temporary undervaluation following a cycle peak that fell short of the model’s projected $210,000 high in 2025.
The model’s fifth percentile previously marked long-term cycle floors. It now sits between $50,000 and $62,000, overlapping with the accumulation range defined by realized price bands.
Traders will be watching Thursday’s key U.S. labor market data for signs on the future path of interest rates and broader risk appetite.


