


TLDR
- BTC slides from $120K peak into correction, now retesting $60K–$65K demand.
- Rejection at $100K–$105K confirmed distribution and accelerated selling.
- Liquidity sits at the $68K–$70K level, where sellers may re-enter.
- Loss of $62K could open path toward mid-to-upper $50K range.
Bitcoin(BTC) price is trading under sustained pressure as it tests a key demand zone between $60,000 and $65,000. After peaking above $120,000, the broader structure shifted into a corrective phase marked by lower highs. Recent selling pushed BTC price swiftly from the mid-$70,000s toward the low-$60,000s. Analysts now focus on whether this historical support band can prevent a deeper structural breakdown.
Bitcoin Price Tests $60K Demand Zone
According to analyst Ted Pillows, the higher-timeframe chart shows a decisive transition from expansion to distribution. Bitcoin price failed to reclaim the $100,000–$105,000 zone late in 2025. That rejection confirmed weakening momentum and triggered accelerated downside movement. The asset then sliced through prior demand pockets with limited resistance.
A major supply block remains between $85,000 and $77,000. This zone previously acted as support before flipping into resistance. When BTC price rebounded, buyers could not sustain acceptance above $85,000. The breakdown below $74,000–$77,000 opened the path toward deeper liquidity levels.
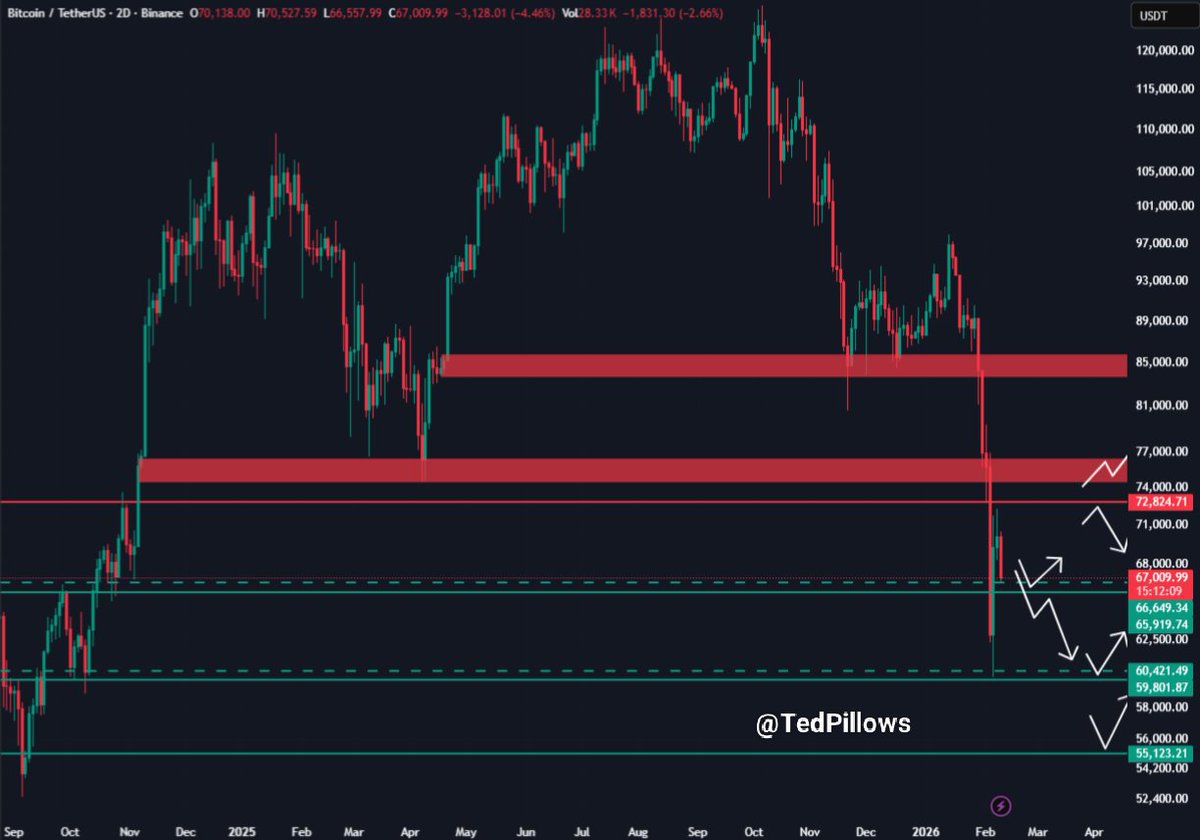
Price is now probing a demand zone between $60,000 and $65,000. Wicks have appeared near $59,000–$60,000, indicating responsive buying. However, volatility remains elevated as rebounds stall near $70,000. Failure to hold the low-$60,000s risks exposing $56,000–$55,000 next.
Bitcoin Price Faces Stacked Intraday Liquidity
Meanwhile, analyst LennaertSnyder’s intraday liquidity map shows BTC price trading near $67,000. Several overhead liquidity pools sit between $67,800 and $69,900. These levels represent resting orders that often attract short-term price sweeps. However, the immediate structure continues to print lower highs.
Each intraday rally has stalled before reclaiming prior breakdown zones. The analyst outlined a potential push toward $68,000–$69,000 to sweep liquidity. Such a move would rebalance order flow after the recent decline. Sellers are expected to re-engage near those liquidity shelves.

On the downside, high-timeframe support begins near $65,000 and extends toward $62,000–$63,000. This grey box marks a key defensive zone for bulls. Acceptance below $62,000 would increase the probability of continuation toward the upper-$50,000s. Conversely, a firm reclaim above $70,000 would ease immediate pressure.

Failed $72K Breakout Reinforces Resistance
On the other hand, another chart highlights a failed breakout above $72,000. After falling from the mid-$70,000s, Bitcoin price attempted to stabilize. A brief move above $72,000 attracted late buyers before sellers absorbed momentum. The rejection reinforced the upper boundary as firm resistance.
From there, the market drifted back toward $67,000–$68,000. This band aligns with prior consolidation and served as a launchpad for the failed rally. Repeated tests have weakened the level as bounces grow smaller. Extended time at support often signals declining demand strength.

If bulls lose the $67,000 zone, price could quickly revisit $65,000. That wick zone marks the last aggressive buyer response. Losing it would confirm continuation of the broader downtrend seen across timeframes. In contrast, reclaiming $70,000 would reopen room toward $72,000 resistance.


