


 Price: Is $600 the Bottom After 55% Crash From All-Time High?")


TLDR
- BNB has fallen 55% from its all-time high and dropped 21% in the past week alone
- Social sentiment reached levels that previously preceded strong price rallies in the past 18 months
- The token is testing the $600 support level with RSI hitting oversold at 14, the lowest in 30 months
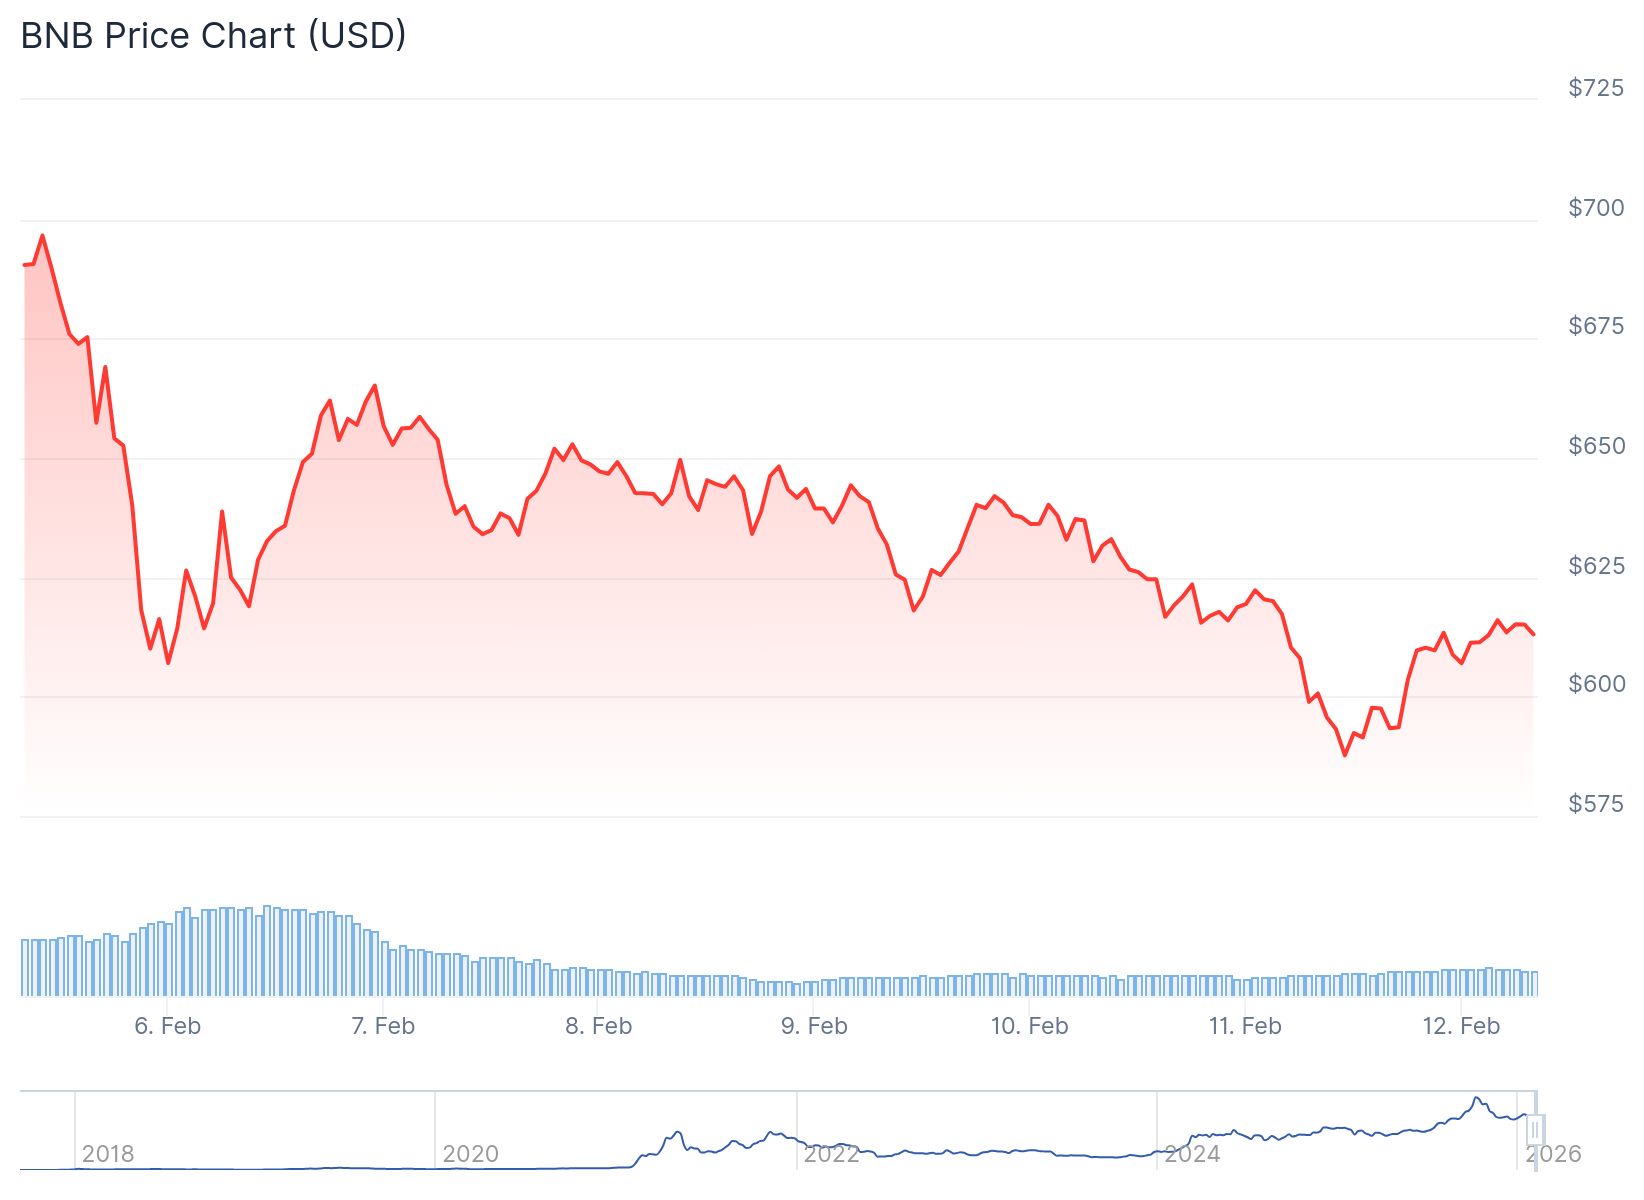
- BNB slipped below the $620 “golden pocket” Fibonacci level and is now trading near $609
- The 200-week moving average is being tested as a key macro support level
BNB is facing serious pressure after dropping below the $620 support zone. The token now trades around $609.
The native token of BNB Chain has lost 31.5% year-to-date. Over the past week alone, BNB dropped 21%.
This makes it one of the worst performers among the top 5 cryptocurrencies during the recent market selloff. The price has fallen 55% from its all-time high reached just four months ago.
The Fear and Greed Index recently hit 5, its lowest level on record. Social sentiment data shows the public is losing interest in crypto markets.
Data from Santiment reveals that Social Volume has reached a key level. This metric tracks how often BNB is mentioned across more than 1,000 channels.
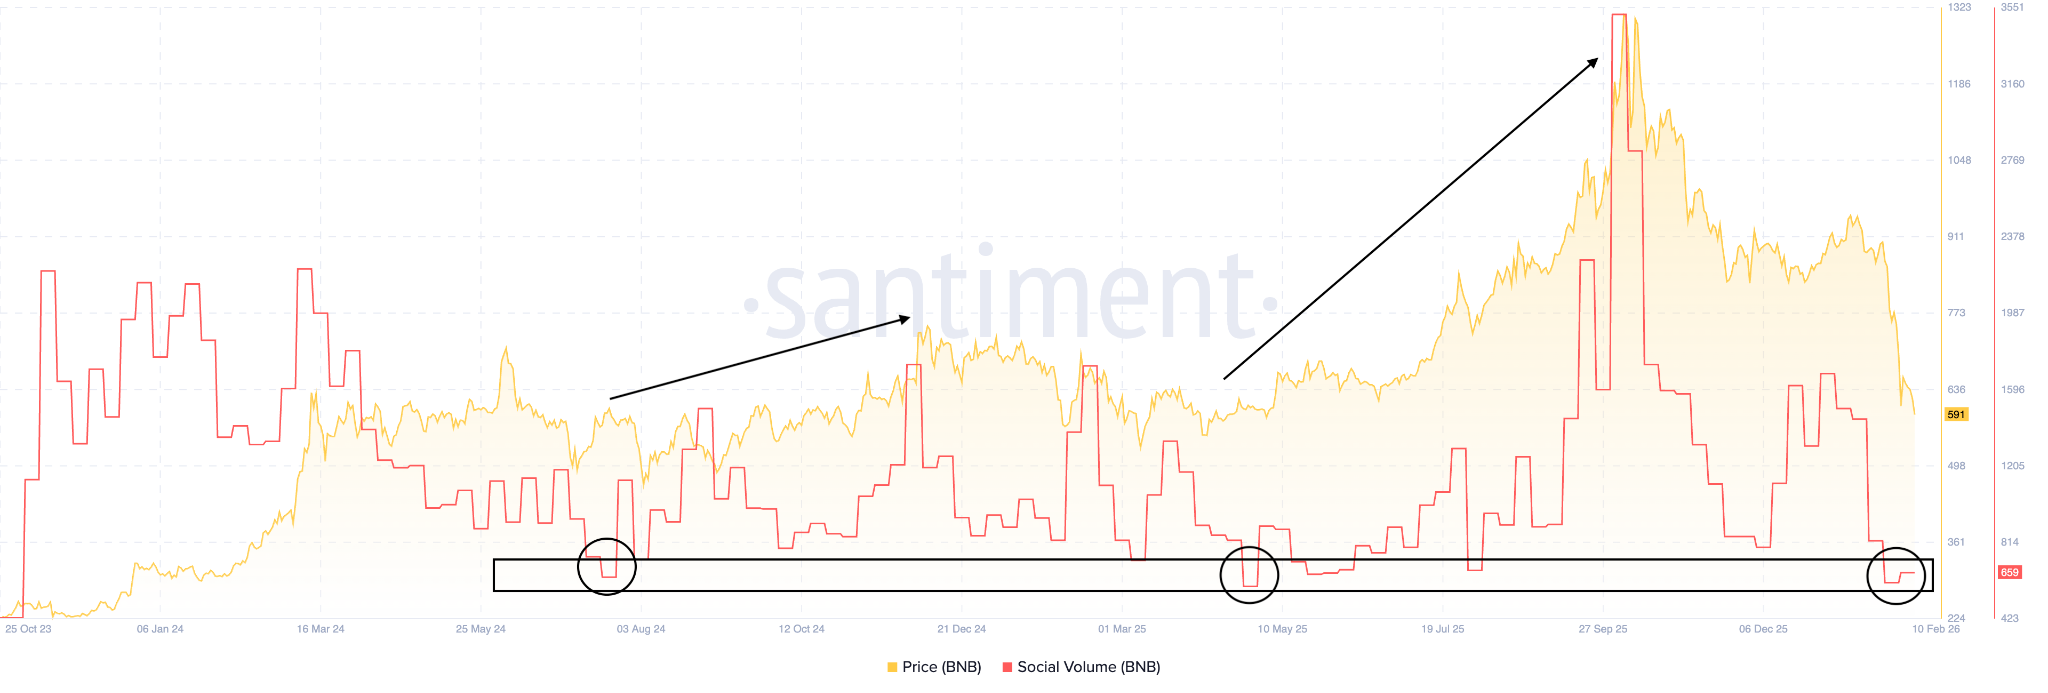
The current reading matches levels that came before two strong uptrends in the past 18 months. On February 8 and 9, BNB ranked 5th and 8th in social ranks among all cryptocurrencies.
Technical Indicators Flash Oversold
The daily chart shows BNB testing support at $600. This is the same level where the token started its rally to new all-time highs.

$BNB is retesting a multi-year trendline — this is the make-or-break level. pic.twitter.com/qfwhaNoPKO
— Token Talk (@TokenTalk3x) February 11, 2026
The Relative Strength Index hit 14 on the daily timeframe. This is the lowest reading in approximately 30 months.
An RSI below 30 typically indicates oversold conditions. The current level suggests extreme selling pressure.
BNB recently lost the $620 level, known as the “golden pocket” in Fibonacci analysis. This represents the 0.618 Fibonacci retracement of the broader advance.
The token is now hovering near the 200-week moving average. This is considered a critical macro support level.
Historically, sustained closes below this moving average lead to extended consolidation periods. Swift recoveries often signal false breakdowns.
Potential Price Targets
If BNB bounces from current levels, the next target sits at $750. This would require the price to reclaim the $620 support zone.
$BNB revisiting its macro trendline after a sharp correction. History shows reactions from this zone can be powerful. pic.twitter.com/a4aKFgf3kz
— FOUR | Crypto Spaces (@X_Four_iv) February 10, 2026
A move back above $620 would strengthen the bullish case. It could indicate a liquidity sweep rather than a true breakdown.
Lower timeframes show bearish signals. Five consecutive sell signals appeared on the 4-hour chart. Eight sell signals showed up on the hourly timeframe.
If BNB fails to hold $600, the next support level is around $520. This represents a 13.3% downside risk from current prices.
Market makers may target stop orders above psychological levels like $600 and $700. These zones have built up liquidity from traders positioning for further downside.
The current market structure has not confirmed a full trend reversal. BNB has not broken down into lower macro territory despite losing the $620 level.
Price action that sweeps below support before reclaiming it is common during bottoming formations. The next few weekly closes will be critical for determining the trend.


