


 Price: Rebounds From Trendline Support as Futures Demand Surges")


TLDR
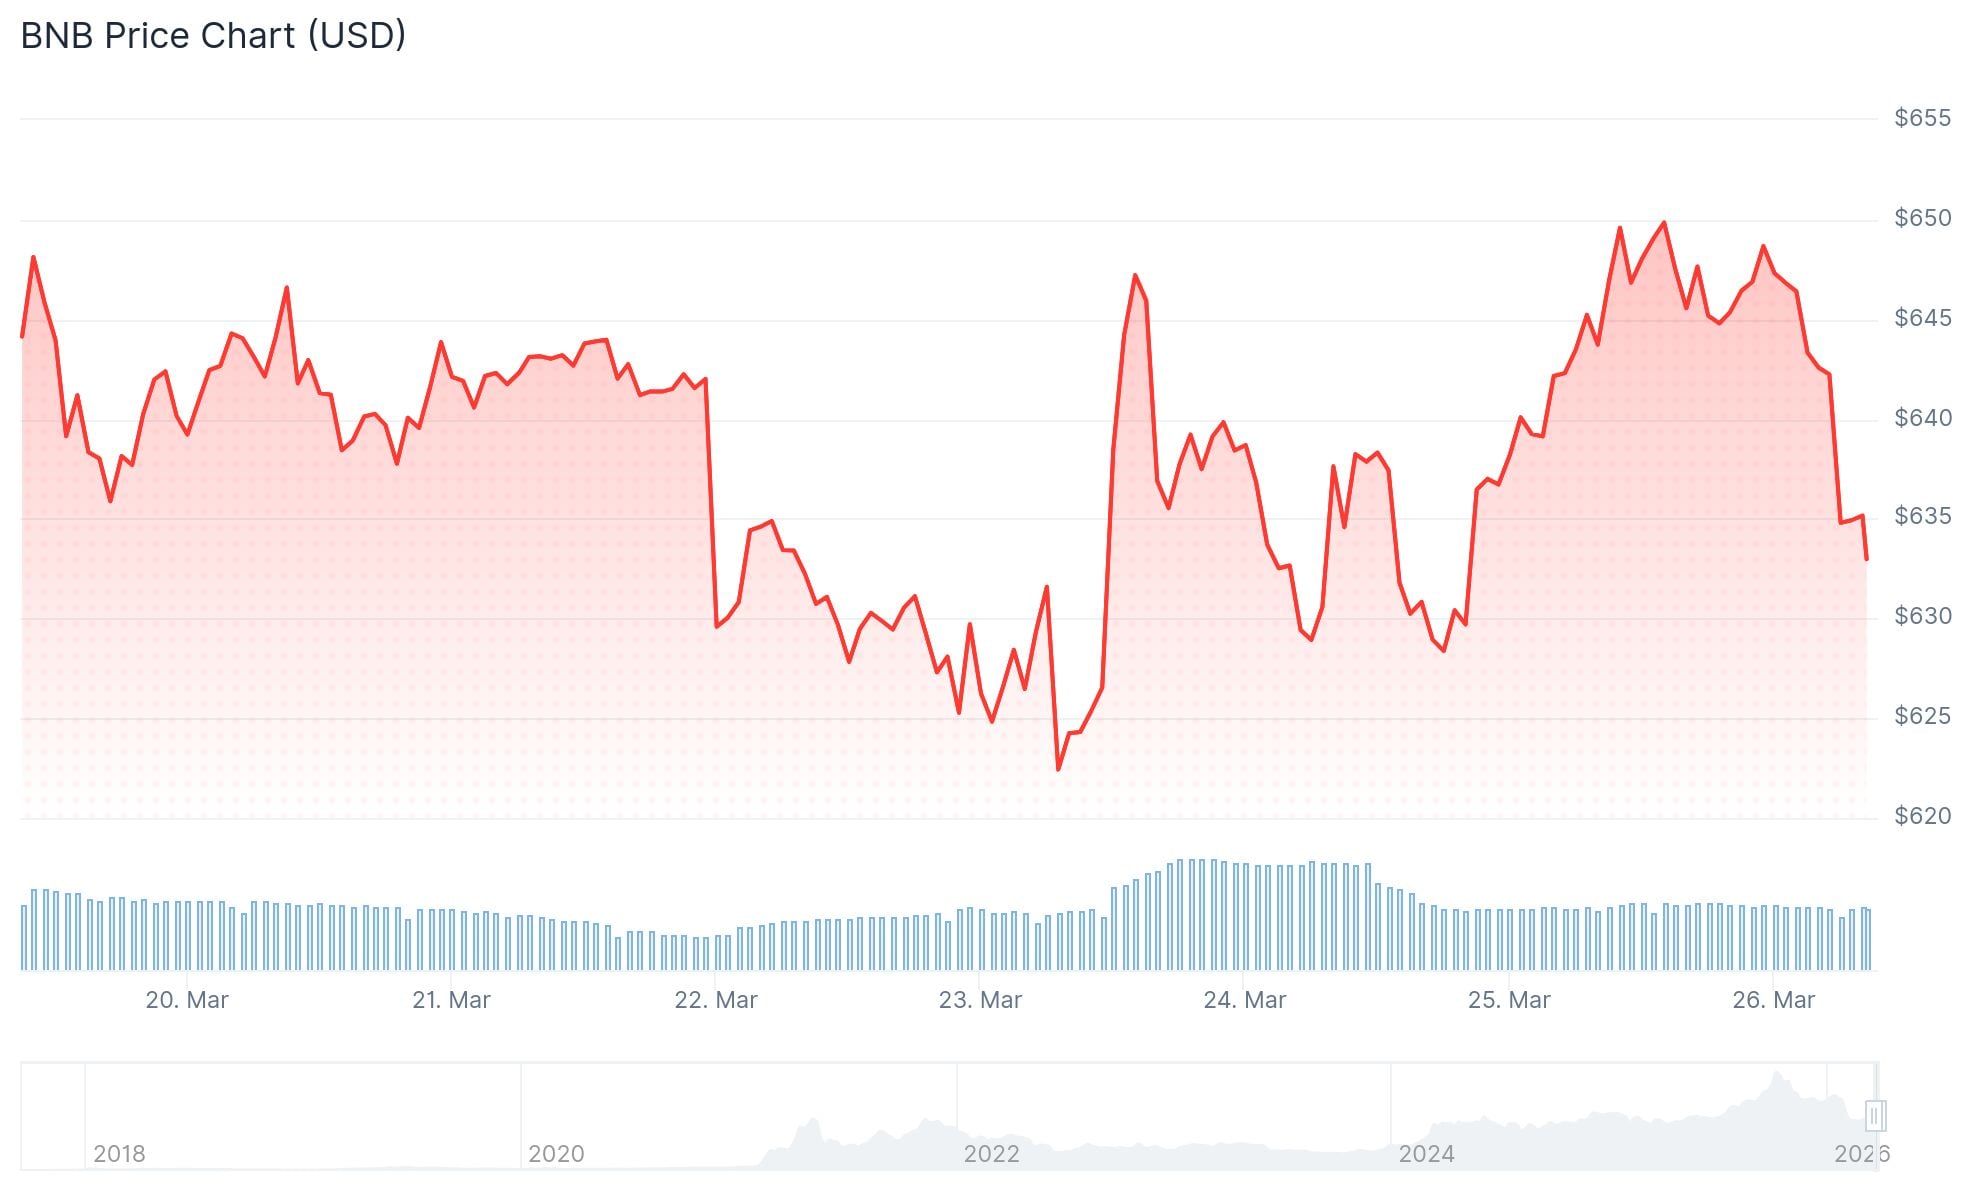
- BNB bounced from an intraday low of $627 back to around $648, supported by improved market sentiment.
- Open interest in BNB futures rose 6.5% to $923 million, with a long/short ratio above 2.21 on Binance.
- BNB holds above a key ascending trendline and is trading within a bullish parallel channel on the daily chart.
- The 20-day SMA has crossed above the 50-day SMA, and BNB sits 53% below its all-time high.
- Price targets from analysts range from $2,000 to $5,000, based on historical cycle patterns and on-chain fundamentals.
BNB bounced off a low of $627 over the weekend and climbed back to around $648 on Monday, March 25. The recovery came as broader market sentiment improved following signs of easing tensions between the U.S. and Iran.
Crude oil prices dropped below $100 to around $87 per barrel as geopolitical fears faded. Bitcoin climbed back above $71,000 and Ethereum approached the $2,200 level in the same period. Asian stock markets, including Japan’s Nikkei 225, the Hang Seng, and Shanghai Composite, also posted gains.
Futures data from CoinGlass shows BNB’s open interest increased 6.5% in 24 hours to $923 million. The long/short ratio on Binance stood at over 2.21, meaning more traders are currently positioned for price increases than declines.
Technicals Point to More Upside
On the daily chart, BNB is trading within an ascending parallel channel. It has held above its lower boundary trendline, which has acted as dynamic support over several weeks.
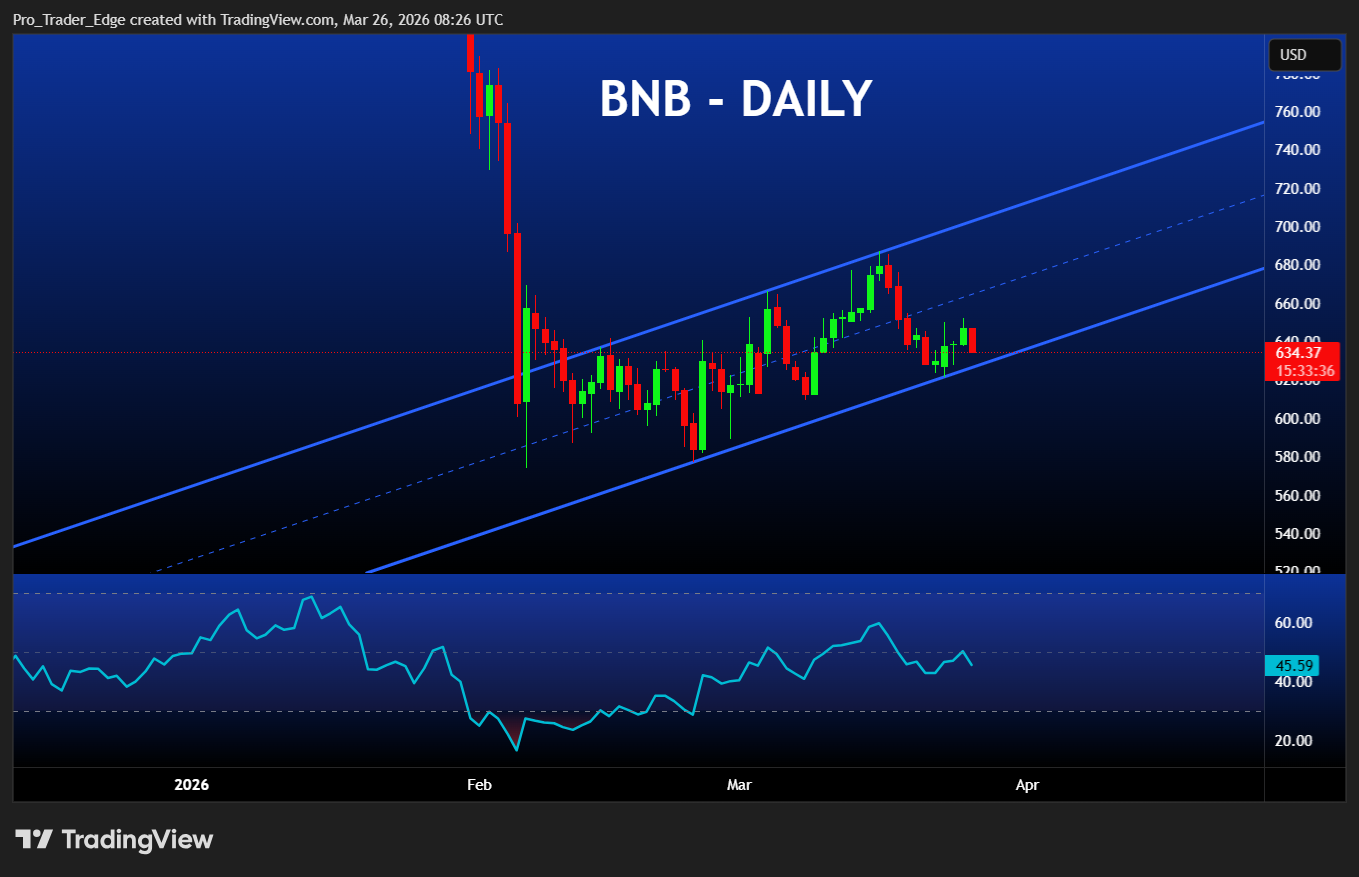
The 20-day simple moving average (SMA) has crossed above the 50-day SMA. This is known as a bullish crossover and is often seen as a sign that short-term momentum is shifting in favor of buyers. The relative strength index (RSI) is approaching neutral levels, suggesting further room to move higher.
The next key resistance level to watch is $685, a level where BNB faced repeated rejection earlier this month. A clean break above that could open the path to the 100-day SMA near $750. On the downside, a drop below $600 would put the current bullish setup in doubt.
BNB currently trades 53% below its all-time high, leaving significant room for recovery if broader conditions remain supportive.

Analyst Crypto Patel called out $BNB’s position 53% below its all-time high, pointing to historical fractals, consistent token burns, and strong fundamentals as the basis for long-term targets of $2,000, $5,000, and even $10,000, with a preferred accumulation zone between $300 and $420.
Will $BNB Hit $5,000 In Altseason?#BNB is Trading at $648 right Now, Sitting 53% below its ATH.
Study the historical fractals and chart structure. The long-term setup looks massive.
Massive adoption. Consistent burns. Strong fundamentals.
Every cycle, BNB surprises the… pic.twitter.com/RDvJBjZhPV— Crypto Patel (@CryptoPatel) March 25, 2026
Burns and Ecosystem Activity Support Demand
BNB continues to benefit from active use within the Binance ecosystem. It is used for transaction fees, trading discounts, and other blockchain services, which supports steady baseline demand.
The token’s supply is also reduced through regular token burns. These scheduled burns lower the total circulating supply over time. Analysts view this as a long-term positive for price, alongside growing on-chain activity.
A previous accumulation zone between $300 and $420 has already been cleared, and some cycle-based models now point to a range of $2,000 to $5,000 as potential targets. These projections are based on historical patterns and market structure data.
As of March 26, BNB is trading near $648 with the $600 support level still intact.


