


TLDR
- BNB fell over 5% and broke below the $600 psychological support level
- Oil prices surged past $110 as Middle East tensions escalated, pressuring crypto markets
- Three consecutive sell signals on the 4-hour chart suggest institutional selling
- A drop to $520 is possible if bearish momentum continues
- The RSI has fallen below 40 on the daily chart, confirming a bearish outlook
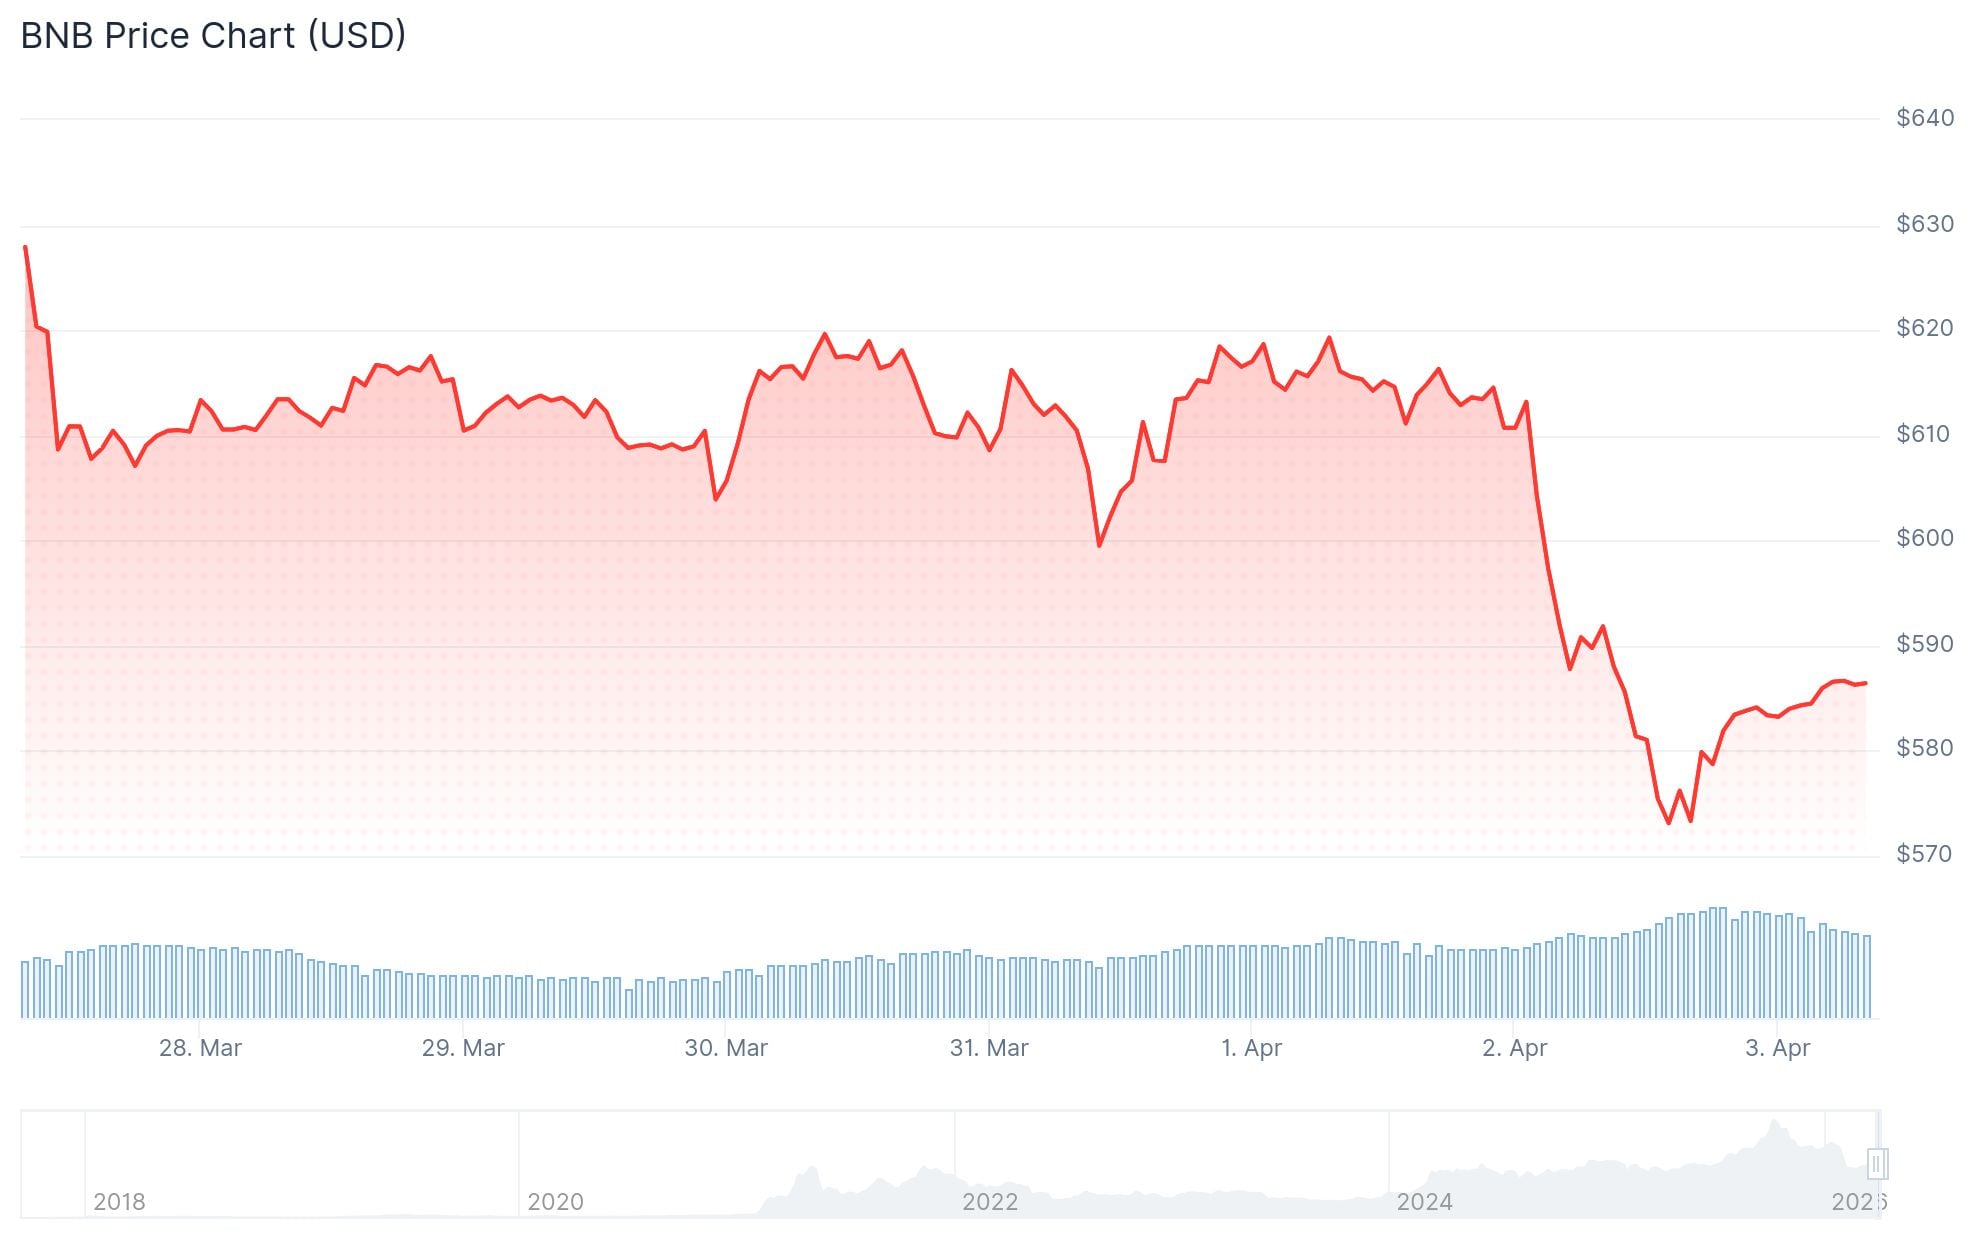
BNB has dropped more than 5% in a single session, slipping below the $600 level that traders had watched closely. The token briefly touched $580 before finding short-term support.
The sell-off comes as oil prices jumped above $110 per barrel. President Trump threatened military action against Iran over access to the Strait of Hormuz, rattling global markets and pushing investors away from riskier assets like crypto.
Trading volume for BNB jumped 35% in the past 24 hours as the price tested the $580 demand zone.
At $580, BNB is trading 57% below its recent all-time high of $1,360. That gap shows just how much selling pressure has built up over recent months.
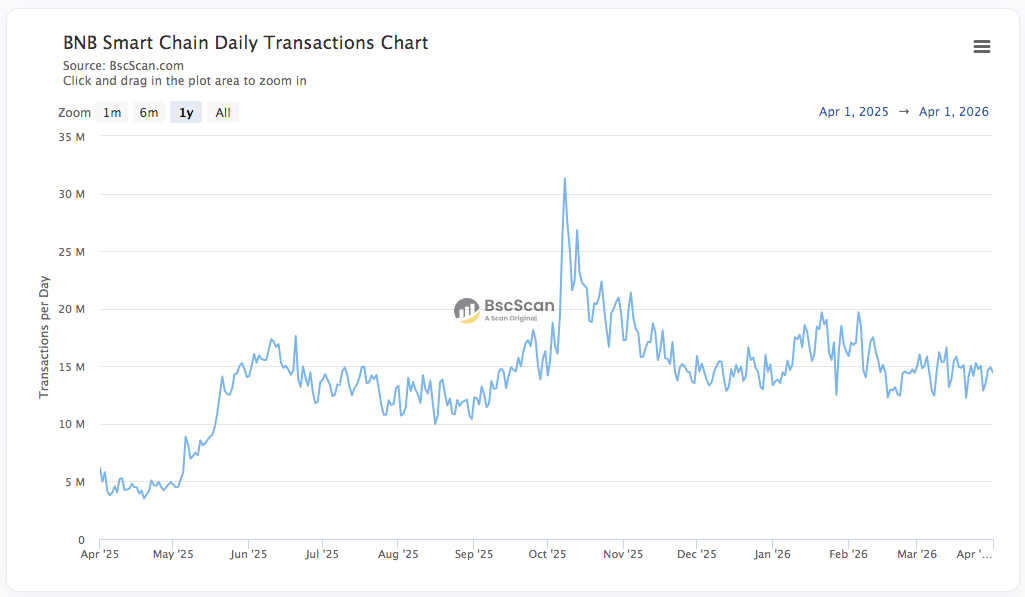
BNB holds two main use cases: fee discounts on Binance and paying transaction costs on the BNB Chain. On-chain data from BSC Scan shows daily transactions running between 13 and 19 million, which is within normal range.
Bears in Control
The daily chart shows BNB has now returned to the $580 level for a third time in two months. Repeatedly needing to return to the same zone for support weakens the case for a near-term rally.
The Relative Strength Index on the daily chart has dropped below 40, which analysts read as a sell signal.

The Federal Reserve’s stance is adding pressure. Analysts no longer expect any rate cuts in 2026. Thirty days ago, around 47% of analysts had expected a cut in June.
Three Sell Signals Since March
On the 4-hour chart, three consecutive sell signals have appeared since March 18. The most recent came after the close of the American trading session on April 2.
These signals point to institutional involvement in the selling. The 4-hour RSI has reached oversold territory, which could produce a short-term bounce.
That bounce, if it comes, may offer short sellers a better entry point before a potential move toward $520.
$BNB Drops Below $570 For The First Time In Over A Year….
I'm Expecting A Strong Bounce From The 0.5 Fib Or 0.618 Fib Level.
Best Accumulation Zone: $400 – $500 (0.5-0.618 FIB Level)
Looking At Historical Fractals & Chart Structures, The Question Is Simple:
Can #BNB Join The… pic.twitter.com/BP0yTZyxXa— Crypto Patel (@CryptoPatel) April 3, 2026
Analyst Crypto Patel posted on X that BNB had dropped below $570 for the first time in over a year. Patel identified $400–$500 as a key accumulation zone based on Fibonacci levels at 0.5 and 0.618, citing historical chart patterns.
BNB is currently in a tight race with XRP and USDC for the fifth spot in total crypto market cap, sitting just $1 billion behind XRP.
The Fear & Greed Index sits at 9, reflecting extreme fear across the broader crypto market.


