


 Price: Bears Stay in Control but This Macro Indicator Is Flashing Bullish")


TLDR
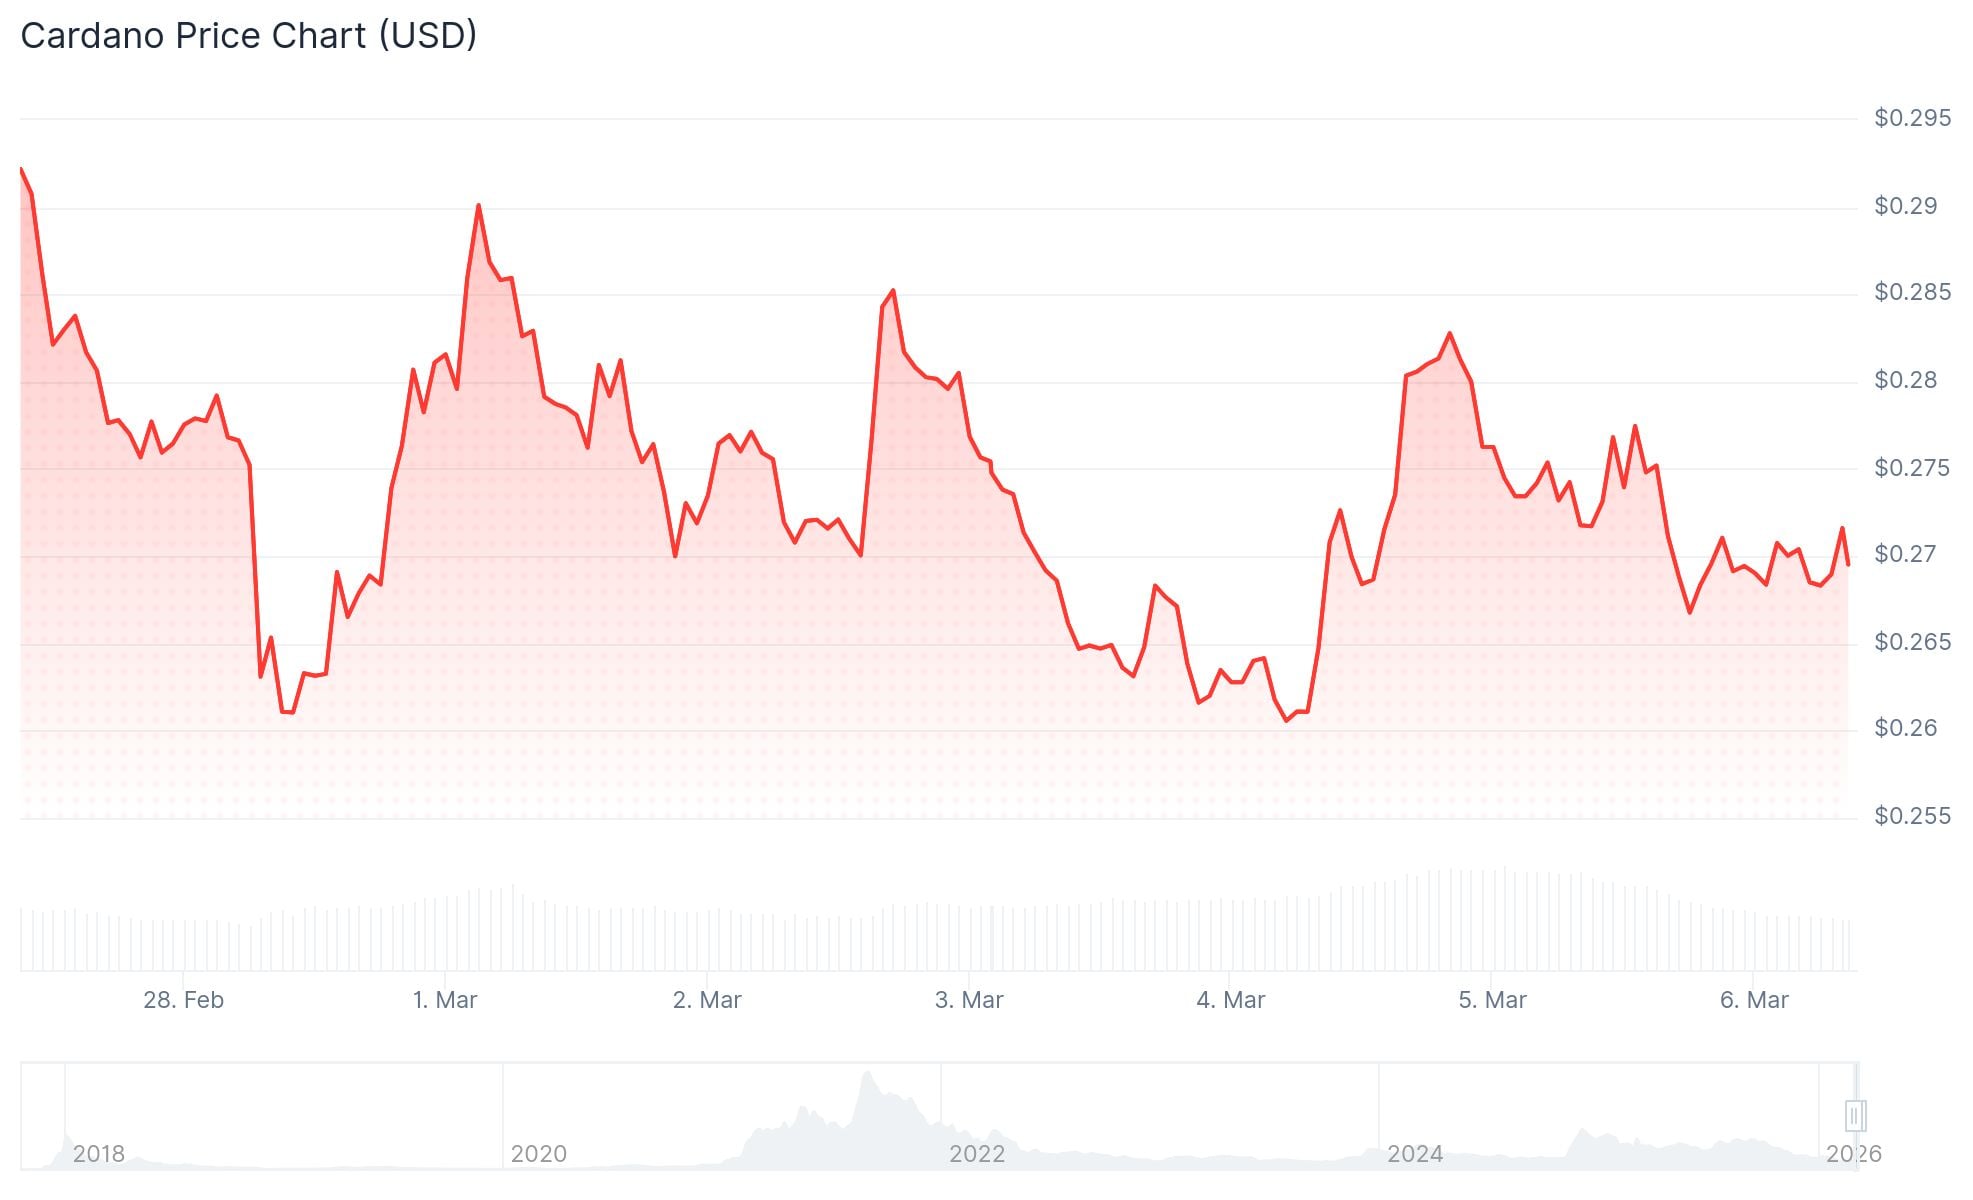
- ADA is trading around $0.27, approaching a key descending trendline near $0.28 that has repeatedly acted as resistance
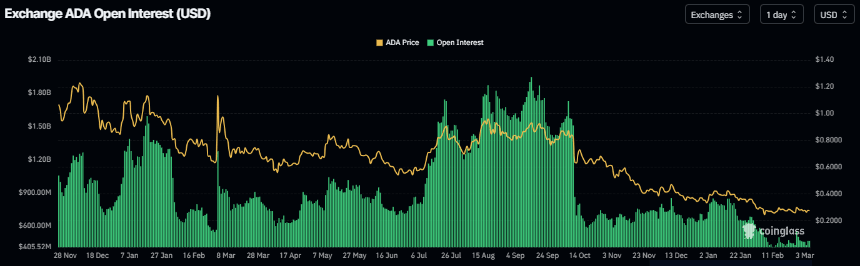
- Open interest has dropped to $462 million while the long-to-short ratio sits at 0.79, both signaling bearish market sentiment
- ADA remains well below its 50- and 100-day EMAs, which are clustered above $0.30
- The RSI sits at 46, below the neutral 50 level, showing weak momentum recovery
- The manufacturing PMI has risen to 52.4%, its third consecutive increase in 40 months, which historically has preceded ADA price expansions
Cardano (ADA) is trading at $0.27 on Thursday, March 6, as price approaches a key descending trendline near $0.28. That trendline has already rejected price once recently and continues to act as the main near-term barrier.
Derivatives data is backing the bearish case. Cardano’s futures open interest has dropped to $462 million and has been falling steadily since mid-January.
A fall in open interest while price stays flat or drops usually signals that traders are pulling back from the market.
The long-to-short ratio on CoinGlass currently stands at 0.79. That figure is near its lowest level in over a month and shows more traders are positioned for price declines than gains.
ADA is also trading well below its 50-day and 100-day Exponential Moving Averages, both of which sit above $0.30. That gap highlights the broader bearish trend in place.
The RSI on the daily chart reads 46. While it has recovered from oversold territory, it remains below the 50 midline, which suggests momentum is still weak.
The MACD indicator is in slightly positive territory, but the histogram is flat. That points to consolidation rather than a clear trend reversal.

Key Price Levels to Watch
On the upside, initial resistance is at the trendline near $0.28. A stronger barrier sits at $0.32, where the descending EMAs also converge.
A daily close above $0.32 would be needed to break the current bearish structure.
Support sits at $0.26, followed by a horizontal floor at $0.24. If ADA breaks below $0.24, it would open the door to further downside.
For now, ADA looks likely to stay in a range between $0.26 and $0.29 unless a catalyst pushes it above resistance.
Macro Indicator Points to Possible Shift
Bitcoin recently surged past $73,000 to a one-month high, but ADA did not follow. It posted only a minor gain and failed to close above the previous day’s candle.
Altcoins have been through one of the longest periods of economic suppression in decades.
Crypto survived all of this.
QT, macro tightening, economic slowdown, and altcoins are still here.
So the question is simple:
What happens if the economy actually starts expanding again?… pic.twitter.com/1bvFsC2WcP
— Dan Gambardello (@dangambardello) March 4, 2026
Market analyst Dan Gambardello has pointed to the manufacturing Purchasing Managers Index (PMI) as a key data point for Cardano’s longer-term outlook.
The PMI, which tracks health in the manufacturing sector, now stands at 52.4%. That is the third consecutive monthly increase in 40 months.
Gambardello notes that past periods of PMI expansion have historically aligned with bullish phases for ADA.
The current setup also resembles the 2019 correction, when ADA posted red candles in six of seven months before recovering strongly.
Quantitative tightening ended in December 2025. Gambardello says that, combined with a rising PMI, mirrors the macro backdrop that preceded Cardano’s last major price expansion.
ADA is currently on its sixth consecutive monthly red candle following a bearish February close.


