


 Price: Market Crash May Set Stage for 200% Rally in Q4")


TLDR
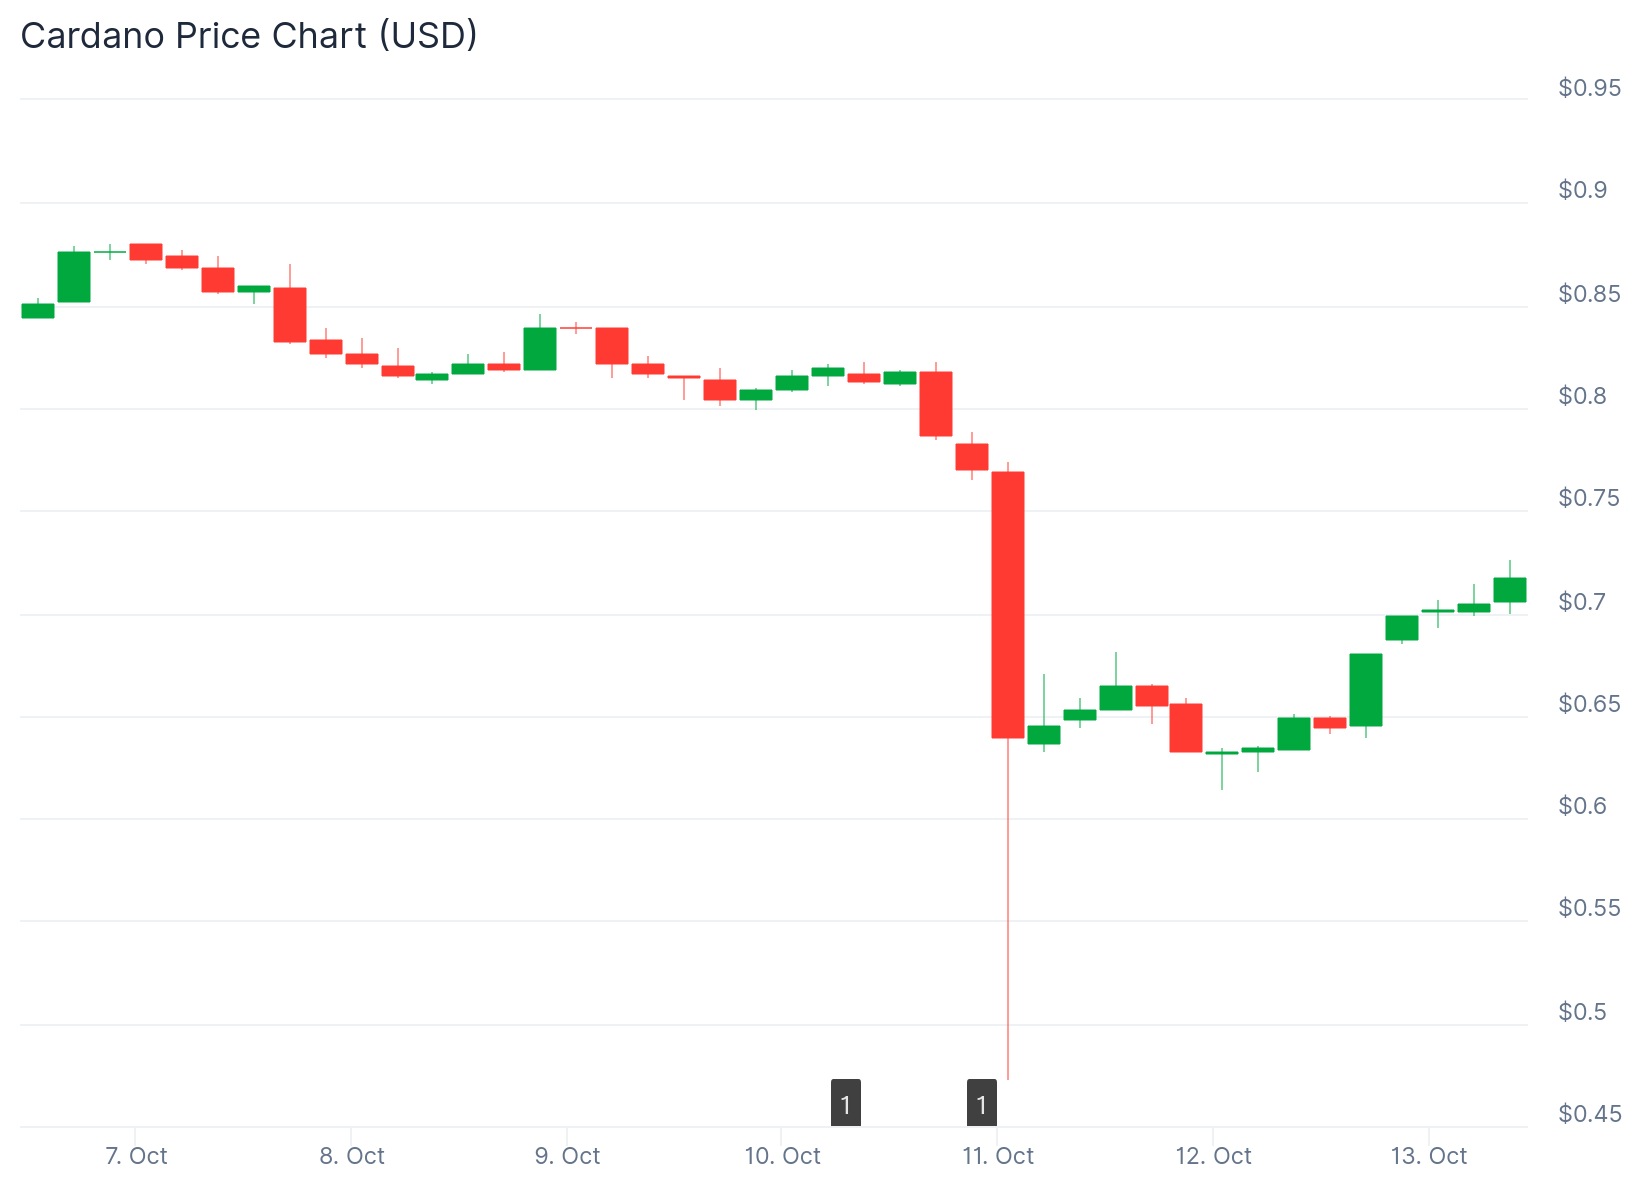
- Cardano (ADA) price dropped 1.36% in 24 hours and is trading near $0.65, down more than 25% for the week and 28% for the month.
- Analysts identify a long-term symmetrical triangle pattern forming throughout 2025 that could lead to a breakout, with potential targets reaching $2 by early 2026.
- The $0.69 level is critical for bullish momentum, while a drop below this could invalidate the upward pattern and delay any rally.
- Analyst Sssebi predicts a rebound toward $0.80 in the coming weeks, while CaptToblerone sees a path to $4 if key resistance levels are cleared.
- The current setup mirrors Cardano’s 2021 behavior before its previous bull run to $3, with the token testing long-term channel support.
Cardano (ADA) fell 1.36% in 24 hours on October 12, 2025. The drop extended a 25.45% weekly loss and a 28.13% monthly decline. The token traded near $0.65 at the time of writing.
The price sits far below its all-time high of $3.10 reached during the 2021 bull market. Despite the recent downturn, analysts are identifying technical patterns that could signal an upcoming reversal.
Market analysts point to a long-term symmetrical triangle pattern forming throughout 2025. This pattern shows ADA’s price tightening between higher lows and lower highs. The compression in price action suggests volatility could soon return.
Symmetrical triangles often appear before breakouts. Many analysts expect Cardano’s next move to be upward. If the pattern confirms, ADA could enter a sustained bullish phase.
Everything’s lining up for Cardano $ADA! $0.69 is the dip to buy before $2. pic.twitter.com/3xQGEN3xWT
— Ali (@ali_charts) October 10, 2025
The $0.69 level serves as the key area to watch. If ADA holds above that line, it could spark a sequence of upside targets. The first target would be reclaiming the $0.95 zone.
After $0.95, the token could test the $1.15 to $1.35 range. Beyond that, analysts see potential for ADA to reach $1.90 or even $2 by early 2026. This would represent more than a 200% surge from current levels.

However, a drop below $0.69 could invalidate the bullish pattern. That breakdown would likely postpone the next rally and shift focus to lower support zones.
Comparing Current Setup to 2021 Bull Run
Market observers have drawn comparisons between ADA’s current behavior and its setup before the 2021 bull run. During that period, Cardano traded within a similar range before exploding to new highs near $3.
Today, analysts note that ADA is testing its long-term channel support once again. This mirrors the historical cycle that preceded the previous major rally. The pattern suggests the token may be entering a critical accumulation phase.
Long-term investors are viewing this phase as a strategic opportunity. Many are accumulating ADA before momentum potentially returns in the next market cycle.
Not all traders are convinced the breakout will happen immediately. Cardano continues to face resistance around the $1.10 to $1.30 zones. These Fibonacci levels have repeatedly capped upward moves in recent months.
Analyst Sssebi said the pullback looked temporary in posts on X. He noted a potential rebound path toward $0.80 within weeks. This would represent a recovery from current levels without breaking the longer-term pattern.
Just woke up after one of the worst nights ever.$ADA will be back above $0.80 in 1-2 weeks.
This type of flash crash is about to push us to new highs🚀
— Sssebi🦁 (@Av_Sebastian) October 11, 2025
Watching Key Support and Resistance Levels
Elliott Wave practitioner CaptToblerone shared a scenario suggesting the decline fits a corrective leg within a larger upward trend. He referenced support near $0.58 as a critical zone aligned with Fibonacci retracement levels.
$ADA – chart update. pic.twitter.com/1n1D4Wtz6Z
— CAPT. PARA8OLIC TOBLERONE (@CaptToblerone) October 4, 2025
CaptToblerone argued that a move above $0.80 would confirm trend extension. That confirmation would open room toward a $2 to $4 long-term target zone. The projection depends on support holding firm around identified levels.
Traders identified several key zones to monitor. The $0.67 to $0.70 area serves as first resistance to reclaim. A stronger ceiling sits near $0.75, where prior attempts stalled.
The $0.58 to $0.55 band marks the next support zone. A clean rebound from that band would hint at base building. Failure there would expose lower levels from past trading ranges.
Moving averages on several time frames showed the token breaking below short-term trend indicators. This technical breakdown added to near-term bearish pressure during the session.
Volume patterns and liquidity shifts around prior swing highs and lows accompanied the recent price action. This behavior often appears during shakeouts that reset positioning before larger trend decisions.
Community voices cited ongoing development as a supportive factor for long-term value. Participants pointed to progress on scaling efforts such as Hydra and Mithril. Staking participation remained a frequent talking point, with consistent staking viewed as a sign of commitment to the network.
The tone in trading forums stayed analytical rather than speculative following the drawdown. Contributors debated whether the move represented a temporary shakeout or a trend change. Several traders preferred to wait for confirmed level breaks before taking positions.
ADA’s price structure on higher time frames still showed a broad sideways-to-up bias. The weekly chart maintained an orderly pattern that had not yet broken down. Analysts framed their outlooks around conditional triggers tied to reclaiming resistance or holding support on closing bases.


