


 Price: Short Liquidations Fuel 10% Weekly Surge")
TLDR
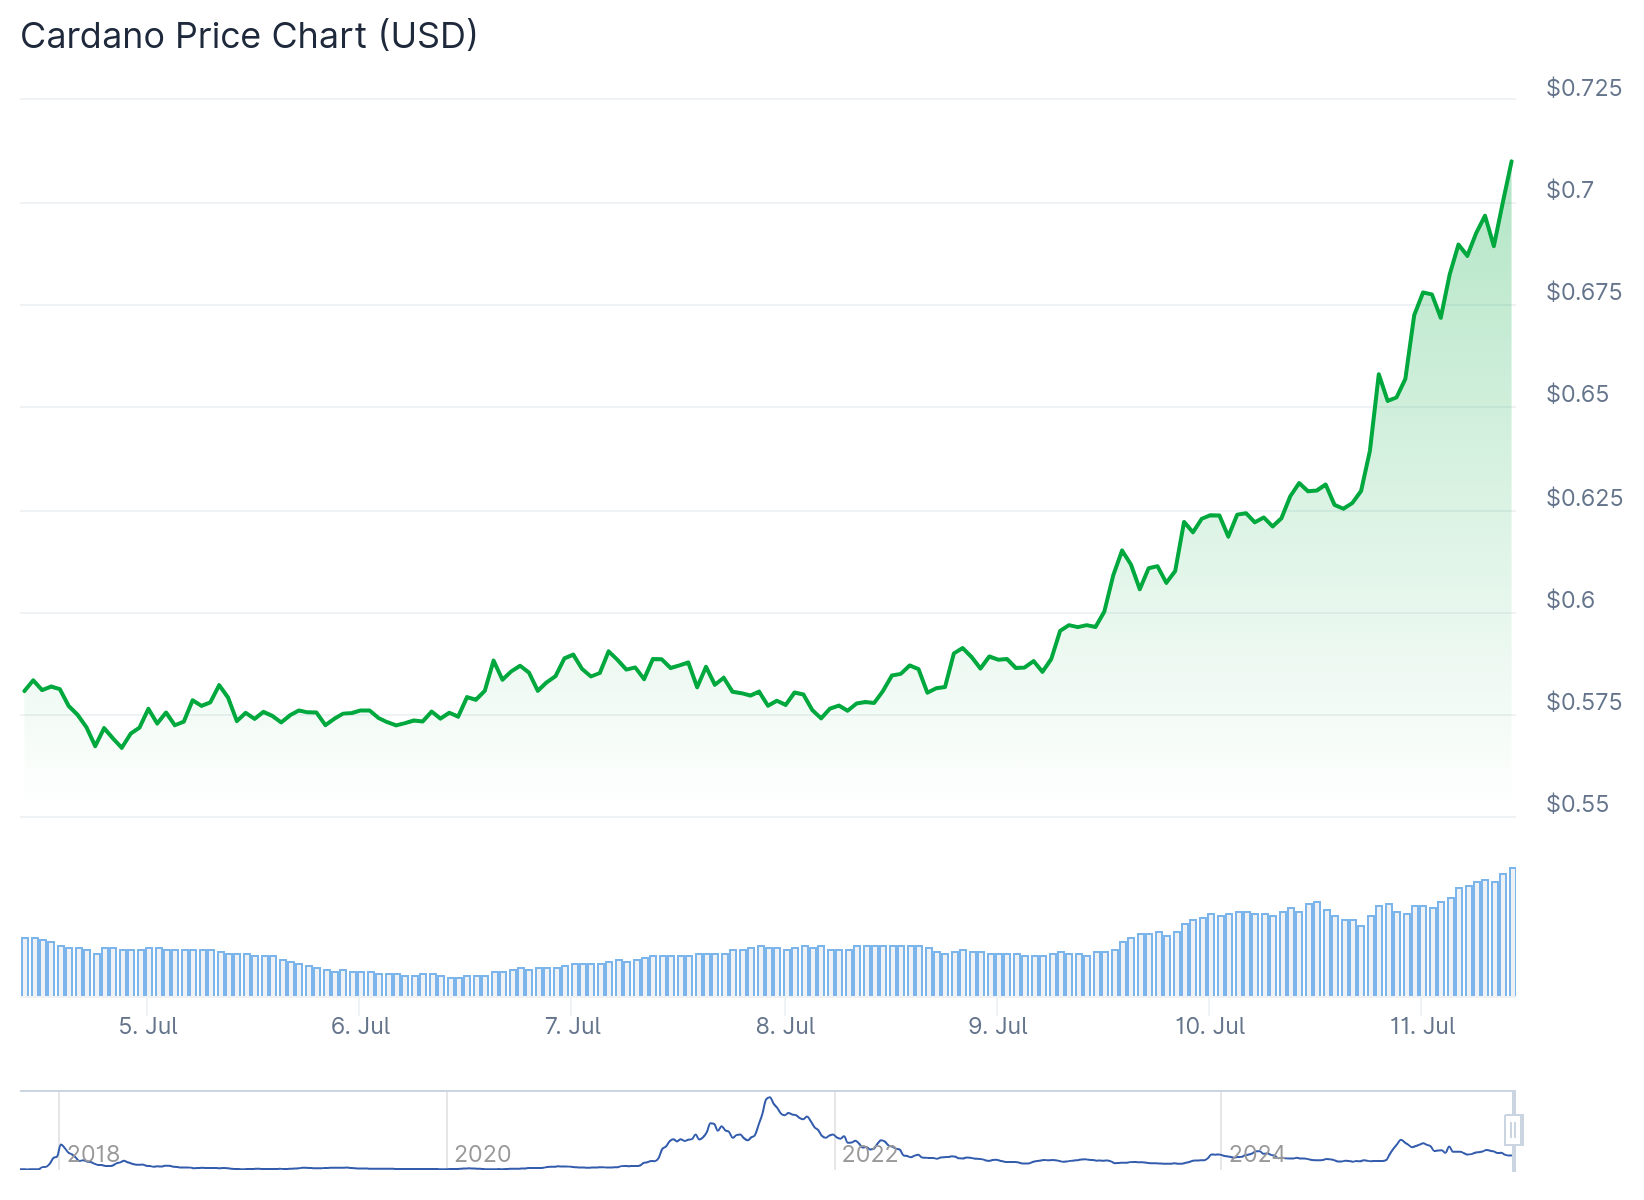
- Cardano has gained 17% since early July, trading at $0.626 with potential to reach $0.66-$0.68 this month
- Daily chart shows bullish momentum with RSI crossing above neutral-50 and higher highs forming over two weeks
- Weekly structure remains bearish with lower highs and lower lows since December, creating mixed signals
- Short liquidations of $2.98 million in 24 hours helped fuel recent 10% weekly gains
- On-chain metrics show declining development activity and reduced network usage since February
Cardano price has shown mixed technical signals as the cryptocurrency trades at $0.626 after a 17% gain from early July lows. The altcoin reached a bottom of $0.536 at the start of the month before beginning its current upward trajectory.
Technical analysis reveals contrasting patterns across different timeframes. The weekly chart maintains a bearish structure with a series of lower highs and lower lows established since December 2024. This longer-term pattern suggests ongoing weakness despite recent gains.
The daily chart presents a more optimistic picture for short-term traders. Cardano has formed higher lows and higher highs over the past two weeks, indicating a potential momentum shift. The Relative Strength Index crossed above the neutral 50 level, typically viewed as a bullish signal.
Price action shows ADA recently broke above the 50% Fibonacci retracement level at $0.62. The On-Balance Volume indicator has also trended higher over the past two weeks, suggesting steady buying demand behind the price increase.
Key Resistance Levels Ahead
Traders are watching the 78.6% Fibonacci retracement level at $0.684 as the next major resistance zone. This level coincides with a fair value gap from June, creating a supply zone that could limit upward movement.
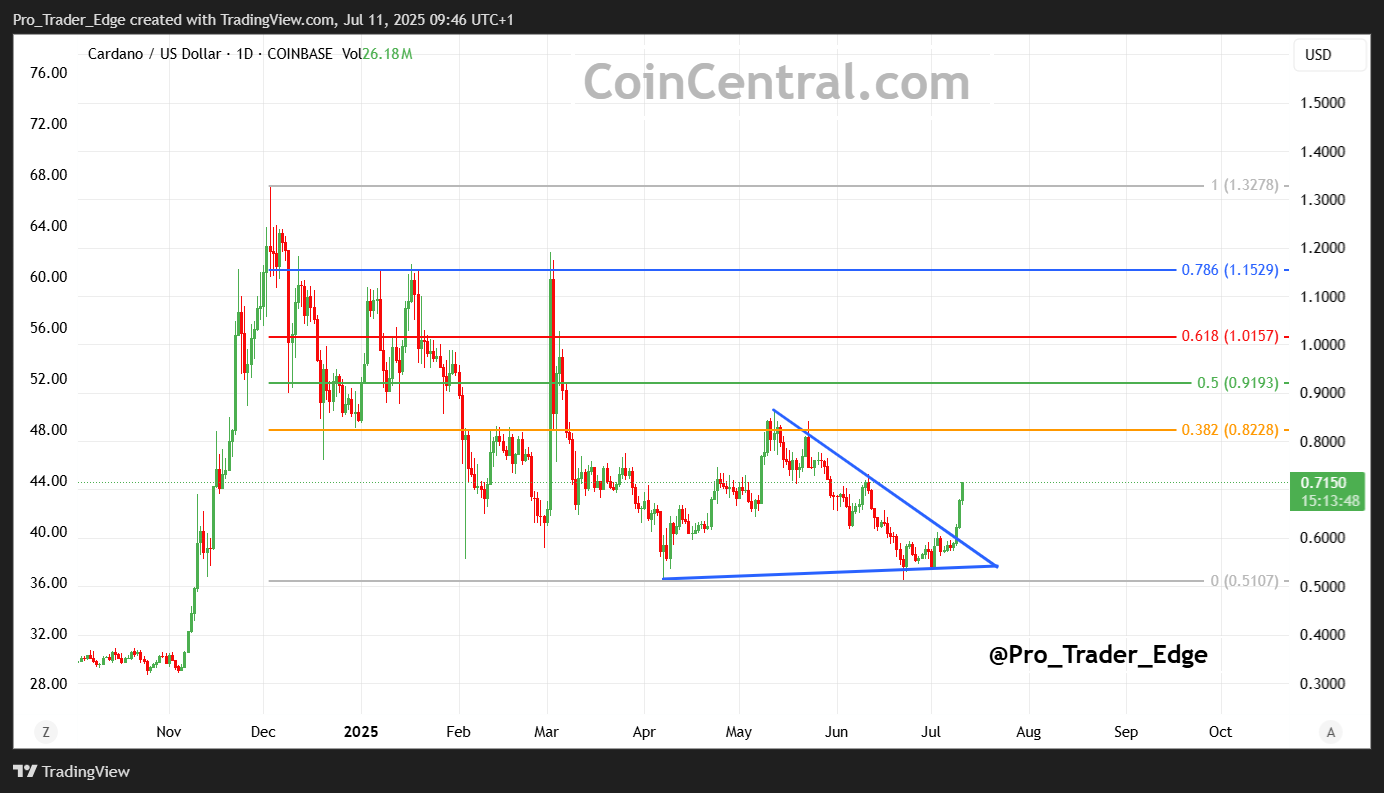
A break above $0.68-$0.70 would signal stronger bullish conviction according to technical analysts. However, reaching this level represents approximately 8% upside from current prices.
The recent rally received support from liquidations in the derivatives market. Short positions worth $2.98 million were liquidated in a 24-hour period, contributing to buying pressure. Total liquidations reached $3.40 million during this timeframe.

Market Dynamics and Institutional Interest
Cardano’s performance has benefited from the broader cryptocurrency market rally. Bitcoin reached new all-time highs above $113,000 on Thursday, providing positive sentiment across altcoins.
Institutional backing has provided additional support for ADA. Reports suggest Donald Trump’s administration may include Cardano in potential cryptocurrency reserves, though specific details remain unconfirmed.
Some analysts speculate about potential Cardano ETF approvals by the SEC. Applications from Grayscale and Canary for spot ADA ETFs were acknowledged in February 2025, though approval timelines remain uncertain.
Price predictions from CoinCodex suggest ADA could reach $0.788964 by August 8, representing a 25.73% increase from current levels. Their analysis indicates neutral sentiment with a Fear & Greed Index reading of 71.
Longer-term forecasts point to potential resistance at $0.97 for 2025. Some analysts project ADA could reach $3.85 by 2030, representing a 550% increase from current prices.

On-chain metrics present a different picture from the price action. Development activity has declined since February, raising questions about network growth. The 180-day circulation metric shows reduced on-chain activity compared to previous periods.
Daily active addresses have remained subdued since March. This metric typically correlates with organic network demand and user adoption rates.
The combination of falling circulation and muted daily active addresses suggests limited organic demand growth. These indicators contrast with the recent price performance driven by technical factors and market sentiment.
Current market conditions show ADA trading near $0.626 with immediate resistance at $0.68 and support holding at the 78.6% Fibonacci level around $0.535.


