


 Price: Slides to $0.32 as Critical Support Crumbles Under Selling Pressure")


TLDR
- Cardano (ADA) trades at $0.32, down 7% in 24 hours, testing the lower end of its critical $0.33-$0.35 support zone that could determine the next major move.
- The token remains trapped inside a descending channel with resistance at $0.38-$0.40, requiring a breakout above this level to signal a trend reversal.
- Large wallet holders have been accumulating ADA during January’s weakness, with buying activity concentrated around the $0.34-$0.35 zone providing potential support.
- A break below $0.32 support would open downside risk toward $0.30, marking a continuation of the downtrend that started in mid-January.
- Daily chart shows ADA testing key support levels, with potential upside targets at $0.37-$0.38 first, then $0.40-$0.42 if buyers can reclaim the current range.
Cardano is trading at $0.32 on January 30, 2026, as the cryptocurrency tests the lower boundary of a critical support zone that has defined its trend direction over recent weeks. The token faces a make-or-break level that will determine whether buyers can defend current prices or if further downside toward $0.30 is ahead.
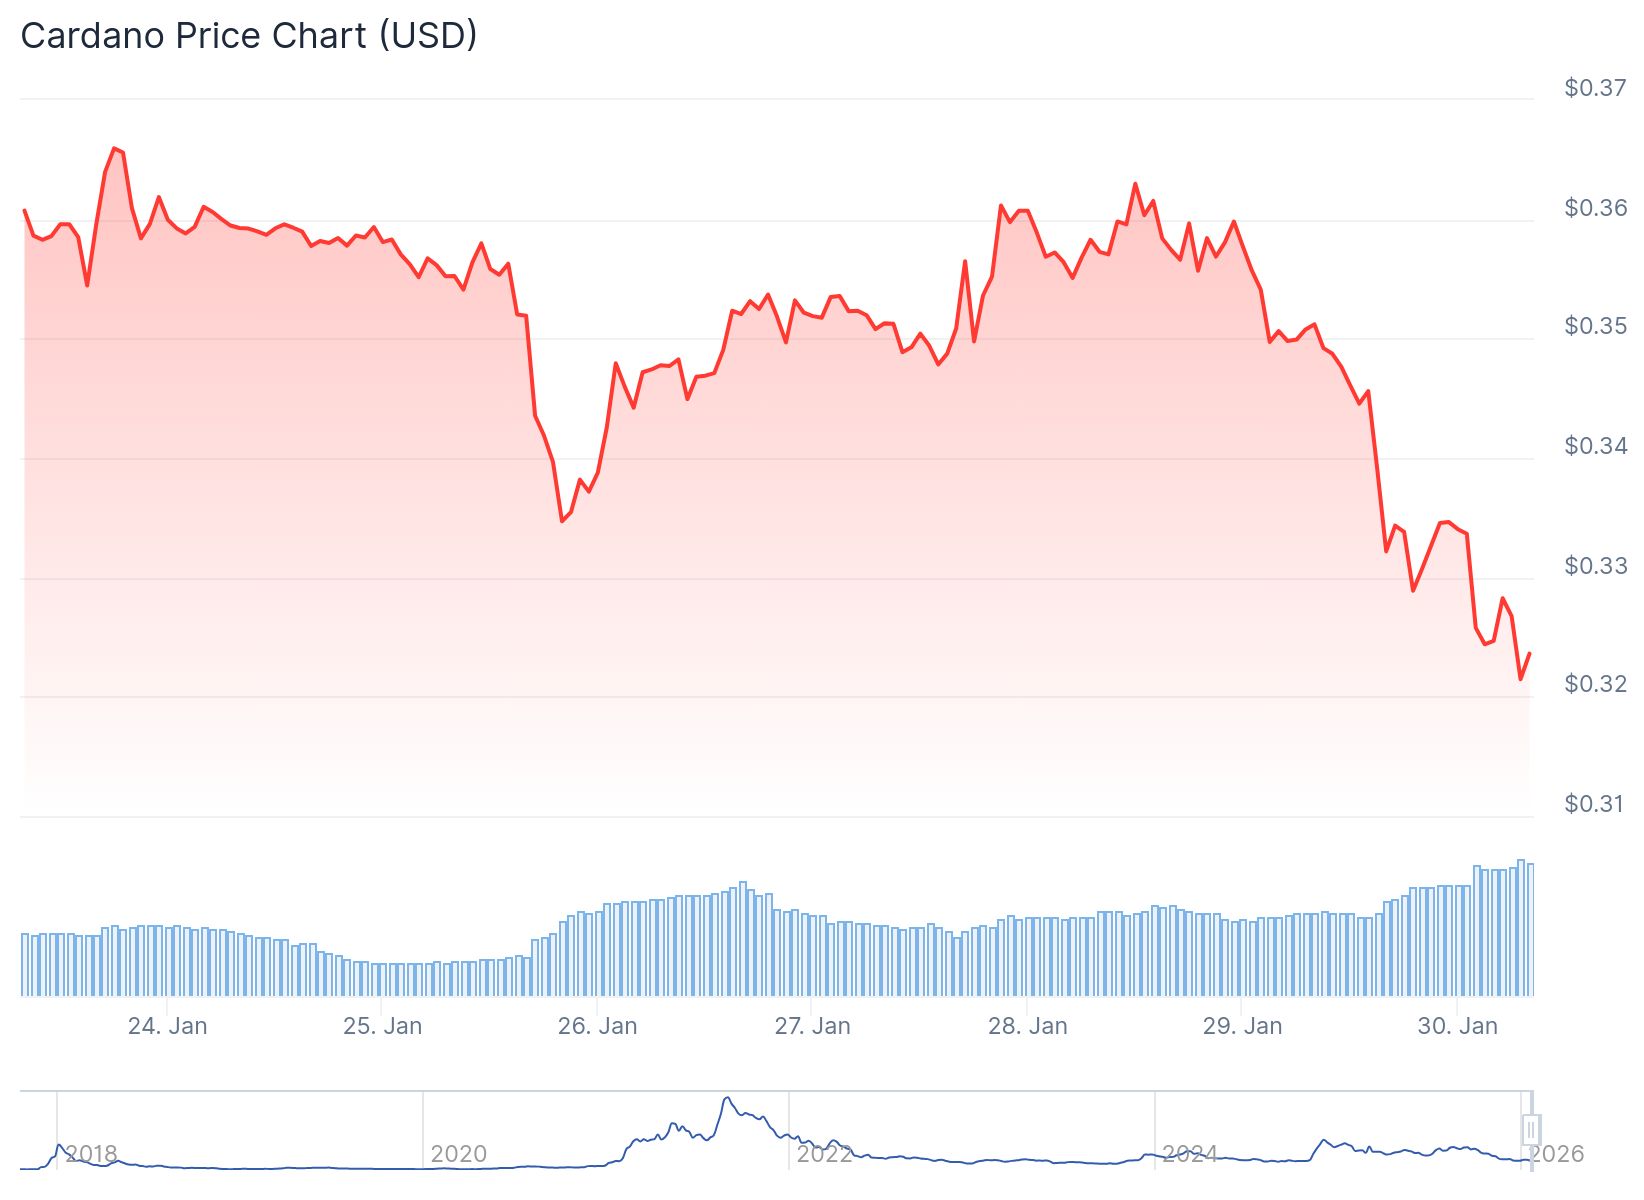
ADA dropped approximately 7% in the last 24 hours, pushing the price down to $0.32 from an intraday high around $0.35. Trading volume reached around $715 million during this decline. The market cap sits at roughly $11.9 billion, placing Cardano at rank 12 among cryptocurrencies.
The recent price action shows ADA breaking below the $0.33 level that had provided support throughout January. The token briefly traded as low as $0.322 before stabilizing at current levels. This move follows a reversal from early January highs near $0.40, erasing most of the gains made at the start of the year.
The technical chart reveals Cardano trapped inside a descending channel pattern. Price remains below key moving averages, with the 200-day EMA sitting around $0.41 acting as dynamic resistance. The downtrend line caps upward movement, making the $0.38-$0.40 region a critical barrier for any recovery attempt.
#ADA has found support near the lower border of the descending channel on the 2D chart💁♂️
This zone remains a strong floor for price action — accumulation is happening right here🧐
If buying pressure increases, $ADA has potential to SURGE toward higher levels✈️ pic.twitter.com/e1JRGknjYc
— Butterfly (@butterfly_chart) January 25, 2026
The $0.32-$0.35 zone represents both the point of control for historical trading volume and the current battleground between buyers and sellers. Price is now testing the lower end of this range, with the $0.30 level emerging as the next major support if selling pressure continues.
Whale Accumulation Provides Potential Floor
On-chain data shows institutional and whale addresses have been net accumulators during January’s pullback. Large orders cluster around the $0.34-$0.35 area, creating a potential floor slightly above current prices. This buying activity provides a counterweight to the technical pressure visible on price charts.

Exchange balance data indicates net outflows over recent weeks, suggesting tokens are moving off exchanges into longer-term storage. This pattern typically reflects accumulation rather than distribution. Staking participation remains high as a percentage of circulating supply.
$ADA CARDANO FOUNDER: “FEBRUARY IS GOING TO BE CRAZY”
Charles Hoskinson said that February would be “a very crazy month,” hinting at major developments he couldn’t yet disclose.
What he could be referring to:
– 🚀 Feb 2025: Plomin hard fork → fully decentralized governance… pic.twitter.com/4OUE5UB6Ym
— CryptosRus (@CryptosR_Us) January 29, 2026
The ecosystem has seen development progress through Hydra scaling solutions and Plutus V3 smart contract improvements. DeFi total value locked has expanded compared to 2024 levels, though it still trails other major blockchains.
Key Price Levels and Market Structure
The daily timeframe shows critical support now being tested at $0.32-$0.33, with deeper backing near $0.30. A loss of the current support zone would shift focus to the $0.30 boundary, which represents the next major demand area and the lower edge of the descending channel.
🚀 $ADA is coiling up at major support
history says a breakout is brewing. pic.twitter.com/q0ix1OX4jg
— Crypto Coral (@Crypt0_Coral) January 29, 2026
Resistance stands at $0.35 in the immediate term, followed by $0.38-$0.40 at the channel resistance. A reclaim of $0.35 would be the first step toward invalidating the current bearish structure. Beyond that, $0.384 marks a near-term breakout pivot that could signal a more meaningful trend change.
Intraday structure shows ADA at risk of breaking its recent base, with the $0.32 level acting as the final defense before the $0.30 zone comes into focus. Sellers appear to be gaining momentum as the market extends below the range that had held for most of January.
The volume profile indicates $0.35 as the heaviest trading activity zone within the broader range. Current prices sit below this level, suggesting the market is operating in a demand zone where buyers had previously stepped in during past pullbacks.
Derivatives markets show funding rates at modest positive levels around 0.01% per eight-hour period. Open interest has declined from earlier January peaks, with total ADA futures open interest dropping to approximately $680 million. This reduction reflects traders stepping back rather than building aggressive short positions.
Cardano’s relative performance shows underperformance versus Bitcoin and Ethereum during January rallies. The ADA/ETH cross has declined from early month levels, indicating rotation away from alternative smart contract platforms. At current prices around $0.32, ADA sits at the lower end of its January trading range.
If the $0.32 level fails to hold on a daily closing basis, technical projections point toward the $0.30 area as the next target. This level aligns with prior cycle lows and represents a psychological support level. A hold above $0.32 and recovery back above $0.35 would be required to shift the near-term outlook from bearish to neutral.


