


 Price: Two Bullish Signals Flash at Same Time as ADA Holds Support")


TLDR
- Cardano’s 365-day MVRV ratio has dropped to -43%, placing it in what analysts call an “opportunity zone”
- Binance funding rates for ADA are at their most negative since June 2023, showing heavy short positioning
- Cardano’s TVL rose 3% in 24 hours to 525.44 million ADA, reflecting steady on-chain demand
- The last time both signals lined up was mid-2023, before ADA rallied roughly 300% over 18 months
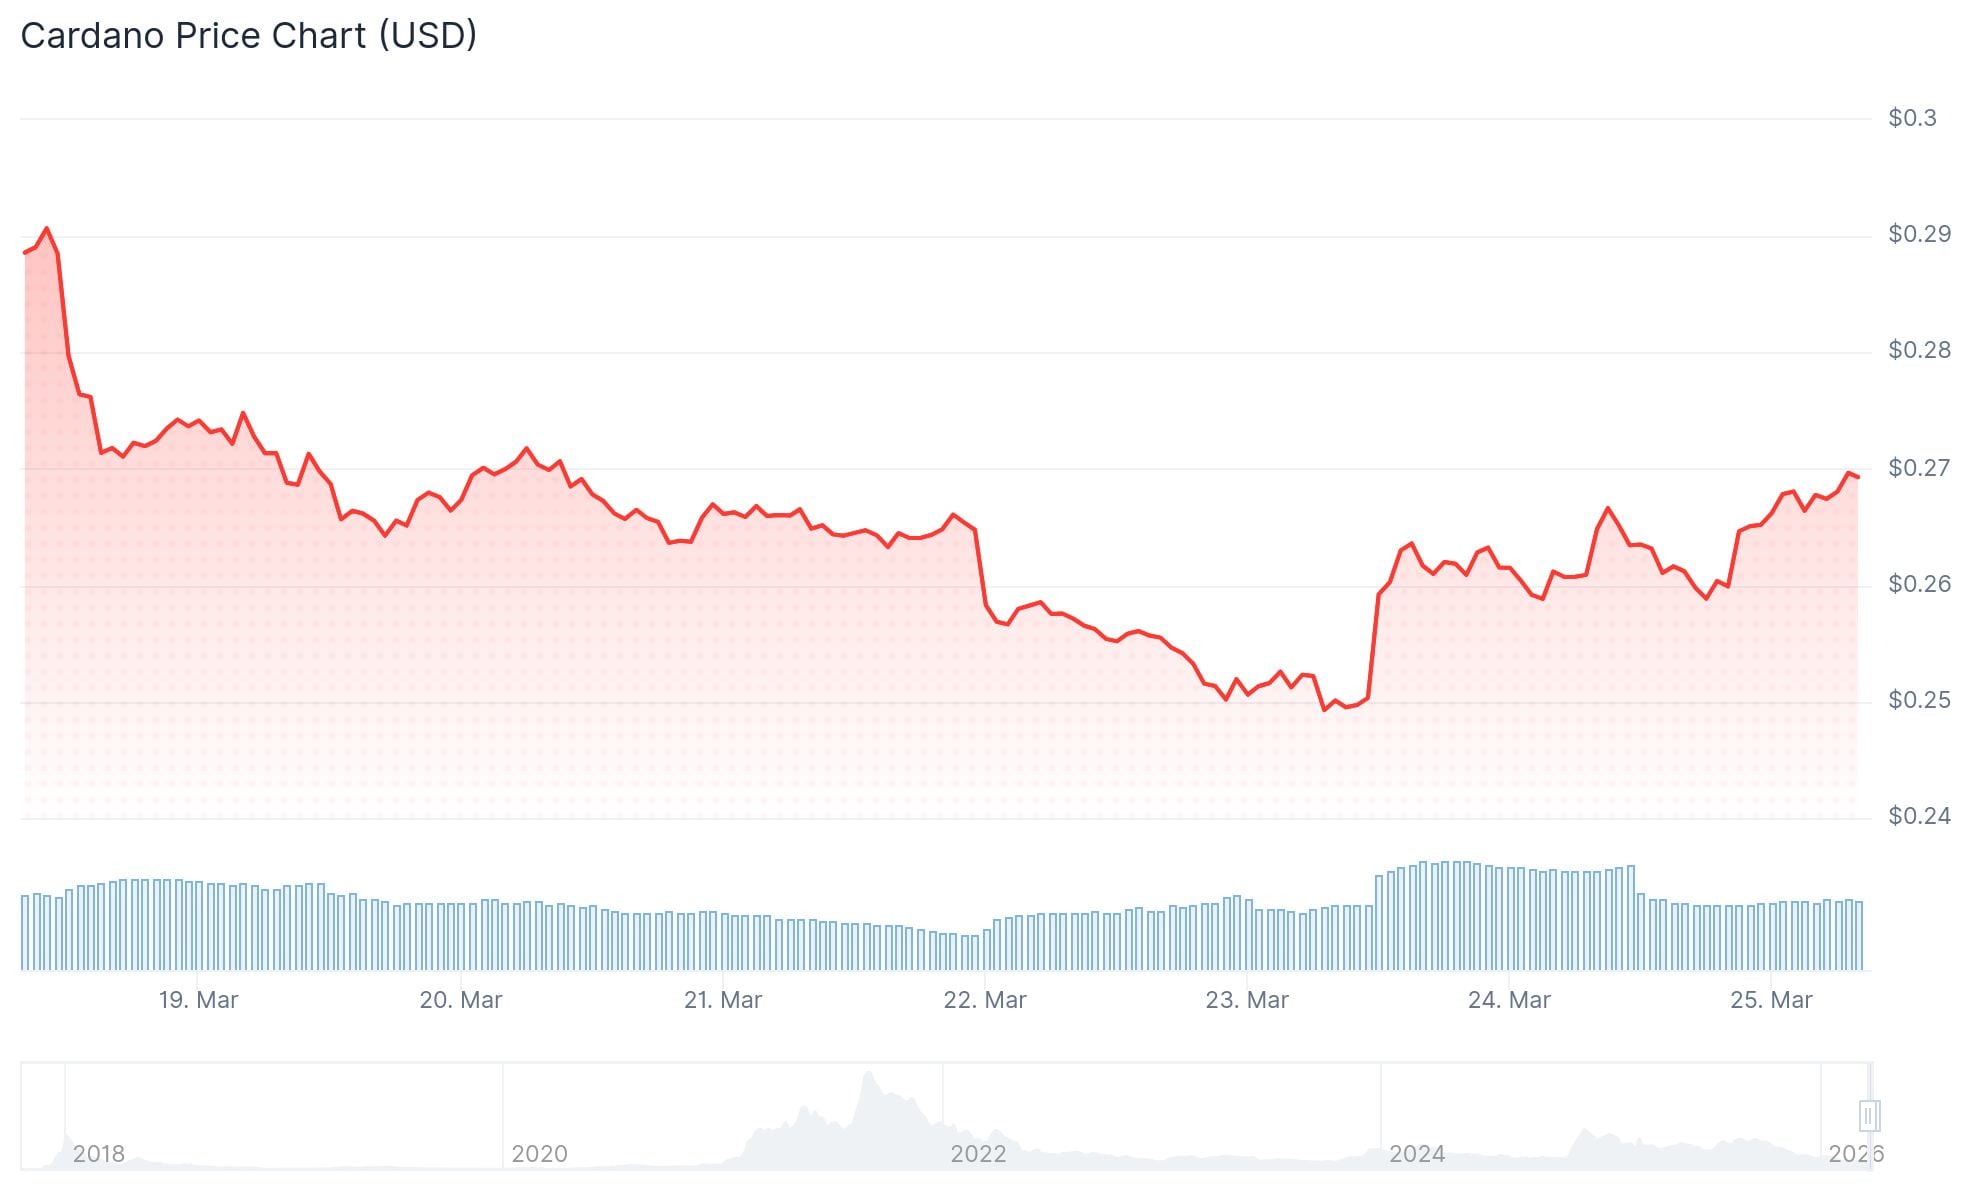
- ADA is trading near $0.26, down about 7% on the week and 71% from its September peak
Cardano is trading near $0.26 after a 4% bounce on Monday. Two on-chain and derivatives signals that have historically appeared before price recoveries are now active at the same time.
The 365-day Market Value to Realized Value (MVRV) ratio for ADA has fallen to -43%. This means wallets active on the Cardano network over the past year are sitting on average losses of 43%. On-chain data firm Santiment labels this level the “opportunity zone.” When MVRV gets this deeply negative, it tends to mean that most panic sellers have already exited the market.

MVRV tracks average trading returns over a set period and historically moves back toward zero over time. When it is this far below zero, holders who remain are generally either committed to holding or have already accepted their losses. That reduces the likelihood of more heavy selling.
At the same time, the weekly average funding rate for ADA on Binance has turned to its most negative reading since June 2023. Funding rates in perpetual futures markets reflect the balance between long and short traders. A deeply negative rate means shorts are dominant and paying longs to hold their positions open.
Why Short Crowding Matters
When short positioning becomes this concentrated, any upward move in price can trigger a chain reaction. Shorts get liquidated, forcing those traders to buy back their positions, which pushes the price higher, which triggers more liquidations.
$SOL Has A Hidden Pattern Most Traders Miss
Every Major #Solana Rally Started With One Signal… A Monthly Bullish Engulfing Candle.
1⃣ 2020: $1.03 → $260 (252x)
3⃣ 2022: $8 → $296 (37x)
3⃣ 2026: Not Yet. But Watch Closely.No Engulfing = No Rally. Every Time.
When It… pic.twitter.com/x18WGwONNG— Crypto Patel (@CryptoPatel) March 24, 2026
This kind of setup has historically been called a short squeeze. On ADA, extreme negative funding rates have tended to precede squeezes more often than they have preceded further drops.

The last time both the MVRV and funding rate signals aligned this closely was mid-2023. ADA was trading around $0.25 at the time and went on to rally roughly 300% over the following 18 months.
DeFi data from DeFiLlama shows Cardano’s Total Value Locked rose 3% in 24 hours to 525.44 million ADA. The TVL metric has trended mostly upward since September’s market pullback.
Technical Levels to Watch
On the chart, ADA is holding above the $0.2436 support level, which was last tested on February 5. The upper range sits at $0.2991, a level last touched on February 26.
ADA remains below the 50-, 100-, and 200-day Exponential Moving Averages (EMAs), all of which continue to slope downward. The RSI sits at 45, just below the neutral midline. The MACD has dipped back below its signal line.
ADA is down roughly 71% from its September peak and about 7% on the week.


