


 Price: Whales Sell $500M as Token Tests Key Support")


TLDR
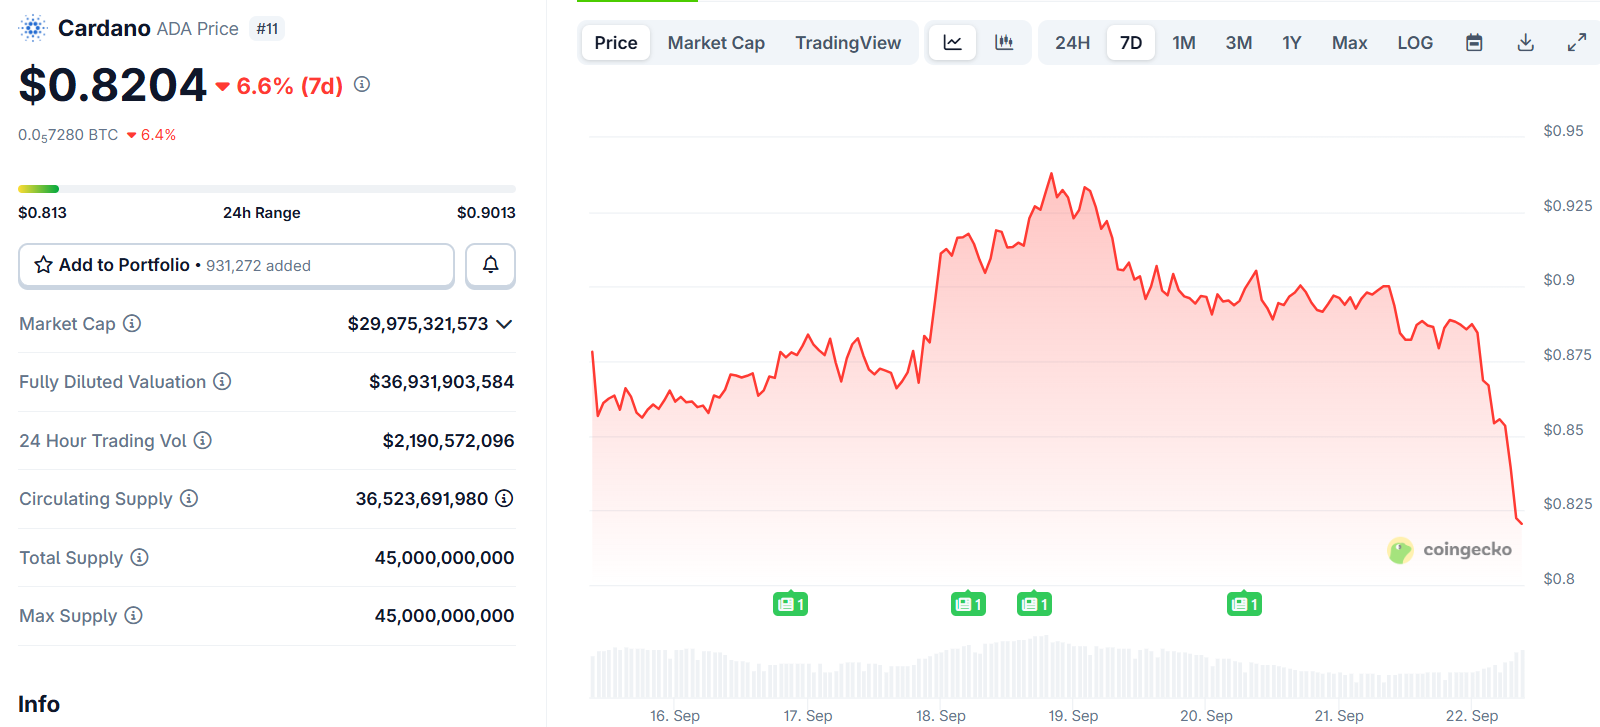
- Cardano price trades at $0.81 after holding support near $0.79 despite recent whale selling pressure
- Whales sold 560 million ADA tokens worth $500 million over four days, creating short-term bearish pressure
- ADA shows an ascending triangle pattern with key resistance at $0.95 that needs to break for further upside
- Technical analysis suggests potential rally to $1.20-$1.25 if Cardano breaks above the $0.95 level
- Price needs to hold above $0.880 support to avoid a drop to $0.837 and maintain bullish structure
Cardano price is trading at $0.81, holding steady above key support levels despite heavy selling from large investors.
Recent whale activity has created headwinds for ADA. Data shows addresses holding between 1 million and 10 million tokens sold over 560 million ADA in just four days. This sell-off was worth nearly $500 million and reflects a lack of conviction among major holders.
The large-scale selling has put pressure on Cardano’s price action. However, the token has maintained its position above the $0.88-$0.90 support zone. This resilience suggests retail buyers are stepping in to absorb the whale selling.
Cardano has historically moved slower than other altcoins during market rallies. The token often consolidates while peers surge higher, only to deliver sharp gains once momentum shifts in its favor. Previous cycles have seen ADA produce rallies of 200-300% within a month when this pattern unfolds.
Technical Pattern Points to Potential Rally
Chart analysis reveals an ascending triangle formation on Cardano’s daily timeframe. The pattern shows higher lows forming under the $0.95 resistance level. This suggests buyers are gradually gaining control despite the recent selling pressure.
Cardano $ADA is pressing against key resistance, forming an ascending triangle on the daily chart.
A breakout above $0.95 could open the path toward $1.20. pic.twitter.com/ZhRCPSr9lG
— TapTools (@TapTools) September 21, 2025
The $0.95 level has emerged as the key breakout point for ADA. A move above this resistance could open the path toward $1.20-$1.25. Volume data is beginning to support this potential move as trading activity picks up.

The super trend indicator sits just below current price levels, acting as a supportive floor for the token. As long as Cardano holds above this technical level, the bullish structure remains intact.
Monthly chart patterns are starting to resemble ADA’s previous major cycles. The current consolidation around $0.87-$0.90 mirrors the 2019-2020 period when the token traded sideways for months before a sharp breakout.
Current Support Levels Under Pressure
Cardano’s immediate support sits at $0.880, just below the current trading range. The token needs to hold this level to maintain its bullish outlook. A break below could trigger a drop to $0.837 and extend recent losses.
Network activity remains subdued, with active addresses staying low. This lack of participation typically limits price gains as fewer traders engage with the platform. Reduced network activity can stagnate capital inflows and cap rally potential.
The RSI indicator is gradually rising from oversold conditions, hinting at improving momentum. Volume trends are also stabilizing after the recent whale selling created volatility.
A successful bounce from current support levels could trigger a recovery toward $0.931. Breaking this resistance would improve sentiment and allow ADA to target the $0.962 level next.
Clearing $0.962 would invalidate the current bearish thesis and bring Cardano closer to the psychologically important $1.00 level. From there, the ascending triangle target of $1.20-$1.25 would come into focus.
160 million Cardano $ADA sold by whales in the last 96 hours! pic.twitter.com/gpmdXLT65k
— Ali (@ali_charts) September 21, 2025
Despite the recent whale selling of 160 million ADA in 96 hours, the token’s price structure has not broken down completely.


