


 Price: Why Smart Money Continues to Accumulate")


TLDR
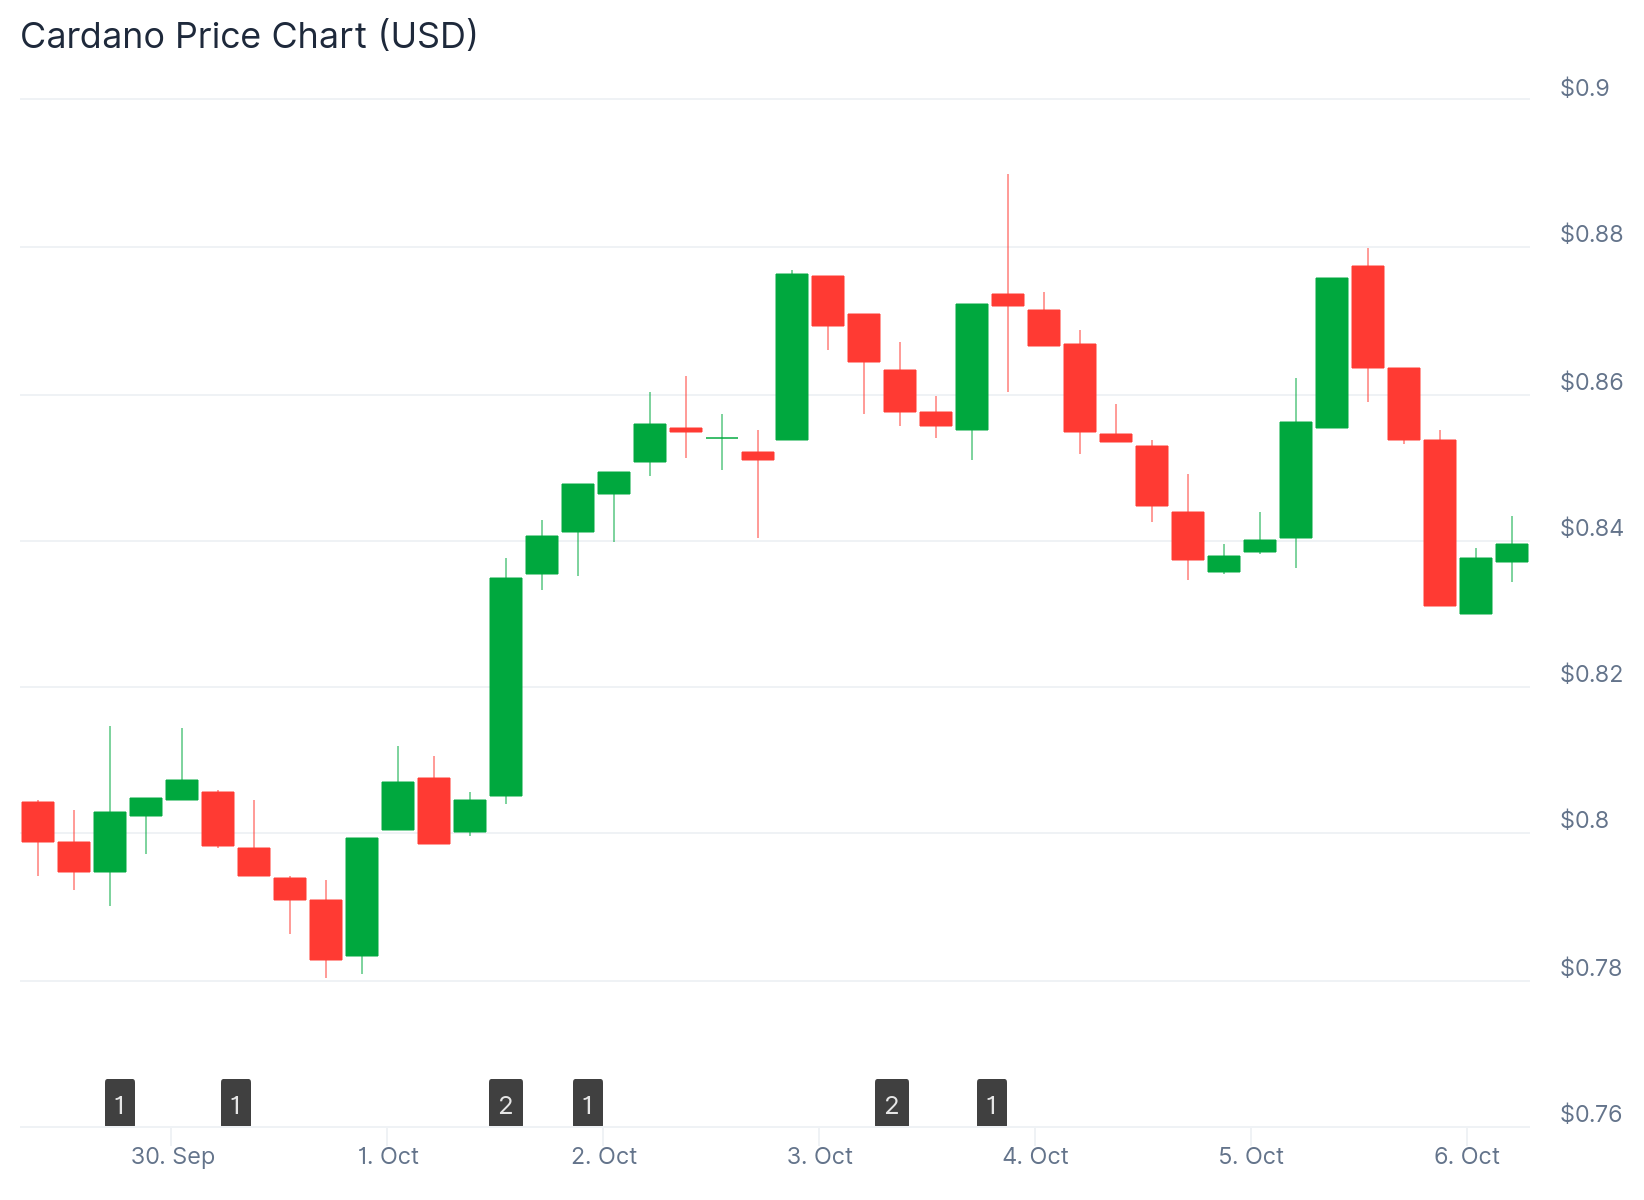
- Cardano is currently trading at $0.84 with a market cap above $30 billion, holding steady above the $0.80 support level
- Coinbase’s Cardano holdings surged 462%, jumping from 1.7 million ADA to 9.56 million ADA in a short period
- Technical analysts identify a symmetrical triangle pattern with potential breakout targets at $1.30 and $1.90
- Key resistance levels to watch include $0.96 and $1.02, while support remains firm near $0.80 and $0.75
- Long-term Elliott Wave analysis projects a potential target around $3.37 if the current accumulation phase continues
Cardano is trading at $0.84, down 1.48% in the last 24 hours. The token has maintained its position above the $0.80 level despite broader market volatility.
This price level has become a defensive floor for ADA. Each time the price dips into this range, buying interest returns quickly.
The $0.80 support has held multiple times over recent weeks. Buyers appear to be accumulating on pullbacks, keeping the token inside a broader ascending structure.
Recent exchange data reveals institutional activity picking up. Coinbase’s Cardano reserves increased from 1.7 million ADA to 9.56 million ADA, a 462% surge.
This type of accumulation typically signals larger players positioning themselves ahead of a potential move. Analyst Mintern highlighted this trend, noting that such reserve growth rarely occurs without a shift in market sentiment.
The institutional buying adds to the technical picture forming on ADA’s charts. The token has been consolidating inside a large symmetrical triangle pattern for several months.
Key Price Levels and Breakout Targets
A breakout above $0.96 could trigger a rally towards $1.30. If momentum continues, the next target sits at $1.90 based on the triangle’s measured move.

Breaking above $0.96 could propel Cardano $ADA toward $1.90. pic.twitter.com/iqhO5kyi1e
— Ali (@ali_charts) October 4, 2025
Trader CW8900 identified $1.02 as the critical level for a “real rally” to begin. This price point aligns with prior rejection zones that capped ADA’s progress through the third quarter.
Breaking through $1.02 could open the path to $1.30-$1.50. Support levels remain at $0.80 and $0.75, providing a clear risk framework for traders.
Technical analyst Butterfly identified a bullish flag formation just under its peak. A breakout from this pattern projects targets toward $1.50 and potentially $2.00.
#ADA is consolidating just below the upper boundary of the bullish flag on the 3D chart🔍
Technical indicators show momentum is shifting bullish — the accumulation phase is finally ending👨💻
When bulls take over, $ADA could absolutely SOAR toward much higher levels🚀 pic.twitter.com/tFdk7NTJfJ
— Butterfly (@butterfly_chart) October 5, 2025
The flag pattern suggests the accumulation phase may be transitioning to expansion. This setup aligns with broader cycle-based projections for ADA heading into 2025.
Long-Term Technical Outlook
Trader Lourenço VS mapped out an Elliott Wave count targeting approximately $3.37 in what would be wave 3 of the cycle. Wave 3 is typically the most powerful phase in a bullish Elliott Wave structure.
The price continues moving inside a broad ascending channel. This channel supports the medium-term bullish outlook as long as the lower boundary holds.
Cardano sits in an extended accumulation zone between $0.80 and $0.85. This type of consolidation often precedes larger rallies when patient buyers absorb supply.
Resistance levels above current prices include $1.10-$1.20 and later $1.90. Breaking these barriers would confirm the rally is gaining traction.
The current market structure shows Cardano defending its support while institutional buyers increase their positions. Coinbase’s reserve data indicates 9.56 million ADA now held on the exchange.


