


 Price: Bollinger Bands Tighten as Bulls Eye a Breakout")


TLDR
- Chainlink added 18 integrations across 22 chains between March 23 and April 5, 2026
- LINK reserves reached 2.93 million tokens through on-chain and off-chain revenue
- ETF flows show only inflows, with zero outflows recorded
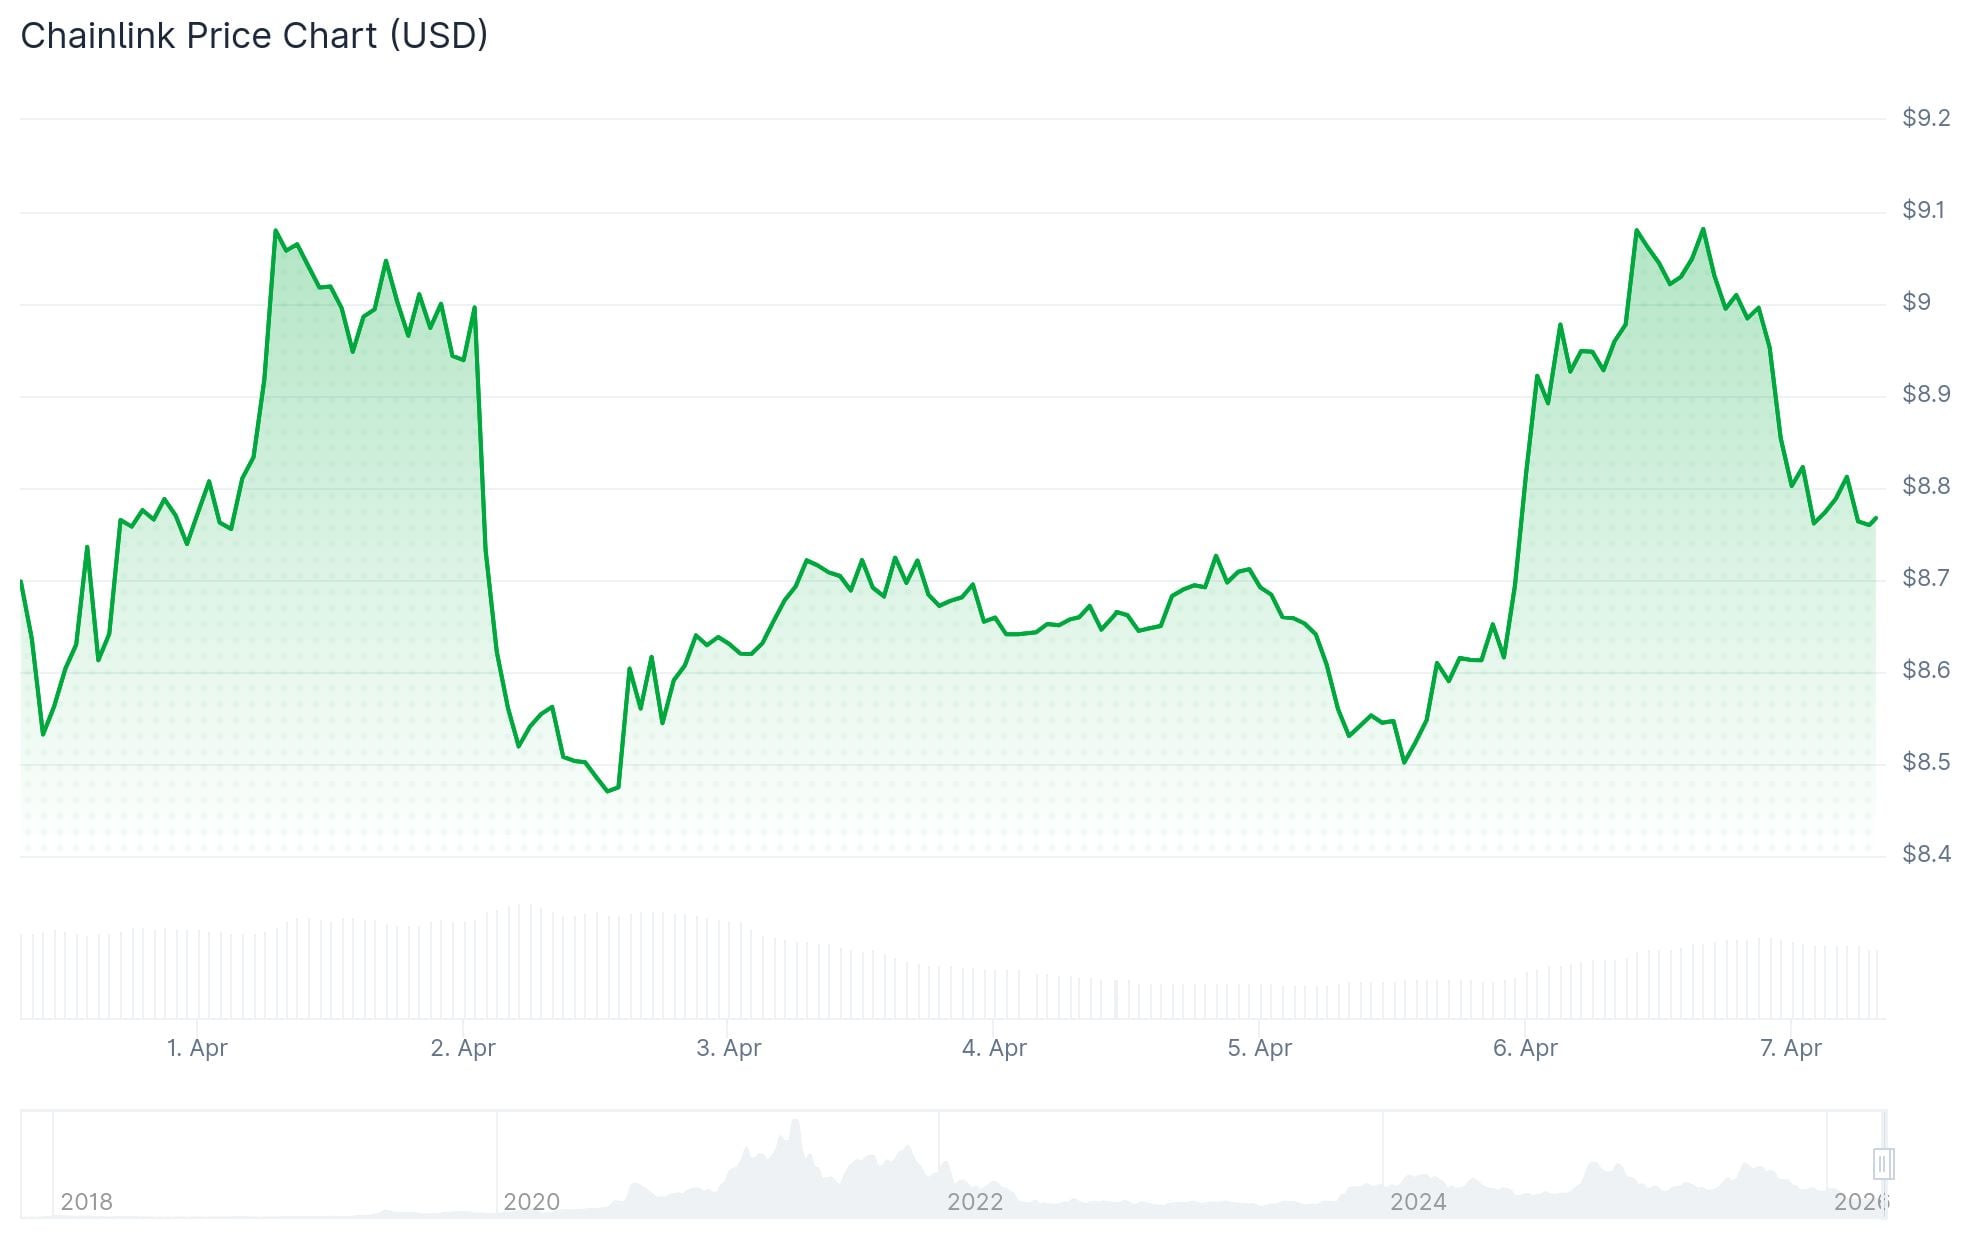
- LINK is trading at $9.08, up 6.21% in 24 hours with $494 million in volume
- Analysts are watching $10.40 as the first key breakout level, with $8 as critical support
Chainlink’s price is sitting in a tight range, caught between $8 support and $10 resistance. The LINK token was trading at $9.08 at time of writing, up 6.21% in 24 hours, outpacing Bitcoin’s 4.05% gain on the same day.
Between March 23 and April 5, 2026, Chainlink confirmed 18 new integrations across nine services and 22 chains. Named protocols include Aave, Coinbase, GMX, Takadao, and Vyro, spanning DeFi, perpetuals, tokenized assets, and exchange infrastructure.
Chainlink Adoption Update 🔗
Recently, there were 18 integrations of the Chainlink standard across 9 services and 22 different chains.
New integrations include @aave, @apyx_fi, @coinbase, @edeldotfinance, FinChain, @GMX_IO, @multiplifi, @opendelta_, @takadao_io, and… pic.twitter.com/niDJQ5i1lC
— Chainlink (@chainlink) April 5, 2026
Chainlink CBO Eid Johann stated in a recent interview that Chainlink secures roughly 80% of the entire blockchain space. The network’s oracles have facilitated nearly $28.6 trillion in transaction volume since early 2022, with smart contracts secured by LINK holding close to $61 billion in assets.
The Chainlink Reserve has accumulated 2.93 million LINK tokens as of April 2, funded through a mix of on-chain and off-chain revenue. ETF flows have shown no outflows, only inflows, since tracking began.
What Analysts Are Watching
Analyst Don identified LINK as sitting in a mini accumulation phase. He mapped a repeating pattern of descending wedges followed by sharp moves, and set a first price target of $10.40. Extended targets sit at $25.36 and $48.37 if the structure holds.
once $LINK breaks out of this accumulation box there is no turning back pic.twitter.com/9s0shhjQNk
— Don 🐂 (@DonWedge) April 6, 2026

The Moon Show flagged a key low near $8.20 on the 4-hour chart. The strategy outlined was to wait for a liquidity sweep below that level before entering long. LINK was at $8.55 at the time of that post, sitting above a demand zone tested multiple times since February.
Crypto analyst Ali Charts noted that Bollinger Bands are squeezing on the LINK 3-day chart, suggesting a large price move could be coming.
Bollinger Bands are squeezing again on Chainlink $LINK 3-day chart, suggesting a big move could be coming soon. pic.twitter.com/ytBKXK46aN
— Ali Charts (@alicharts) April 7, 2026
Leverage Zones Create a Clear Battlefield
The liquidation heatmap shows heavy leverage stacked at both $8 and $10. A break below $8 could trigger a cascade toward $6 as long positions unwind. A flip above $10 opens the path toward $12 and $14 through short liquidations.
LINK’s 6.21% move on Monday came alongside a 73.51% spike in trading volume, ruling out passive price drift.
The CLARITY Act, currently moving through Congress, could codify LINK’s commodity classification into statute, which analysts have flagged as a longer-term institutional catalyst.
A confirmed close above $10.40 would likely force a reassessment of short positions across the market.


