


 Price: Whales Accumulate 54 Million as Bulls Eye Triangle Breakout")


TLDR
- Chainlink rebounded from the $16 demand zone, which has historically fueled strong recoveries for the token
- Whales accumulated 54 million LINK tokens around the $16 range, reinforcing it as a strong support level
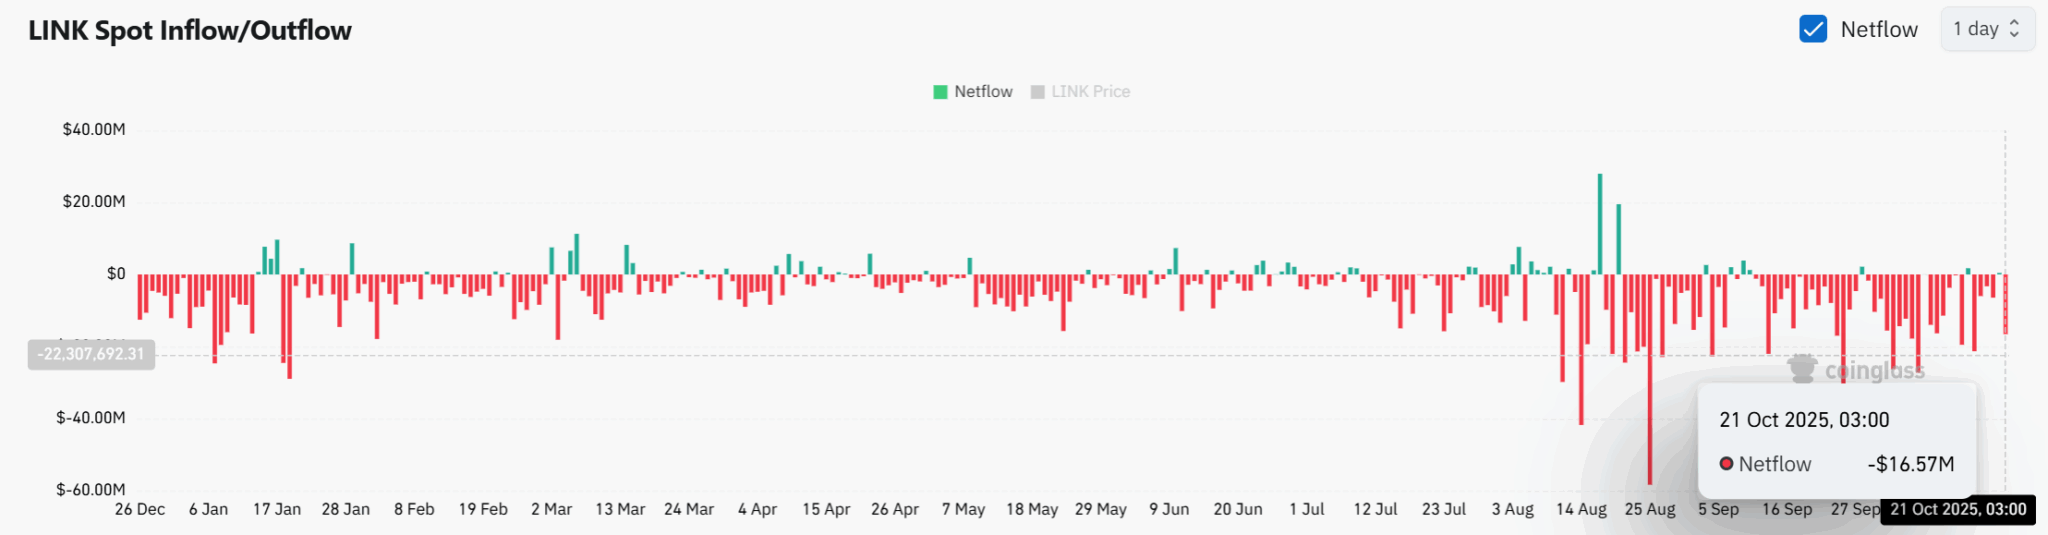
- Exchange outflows totaled $16.57 million on October 21, reflecting declining sell-side liquidity
- LINK trades within a symmetrical triangle pattern formed since 2022, approaching a potential breakout point
- Immediate resistance sits at $19.95, with analysts targeting $27 by December if breakout occurs
Chainlink recently bounced back from the $16 price level, an area that has repeatedly triggered strong recoveries. The token trades within a descending channel pattern on the daily chart.
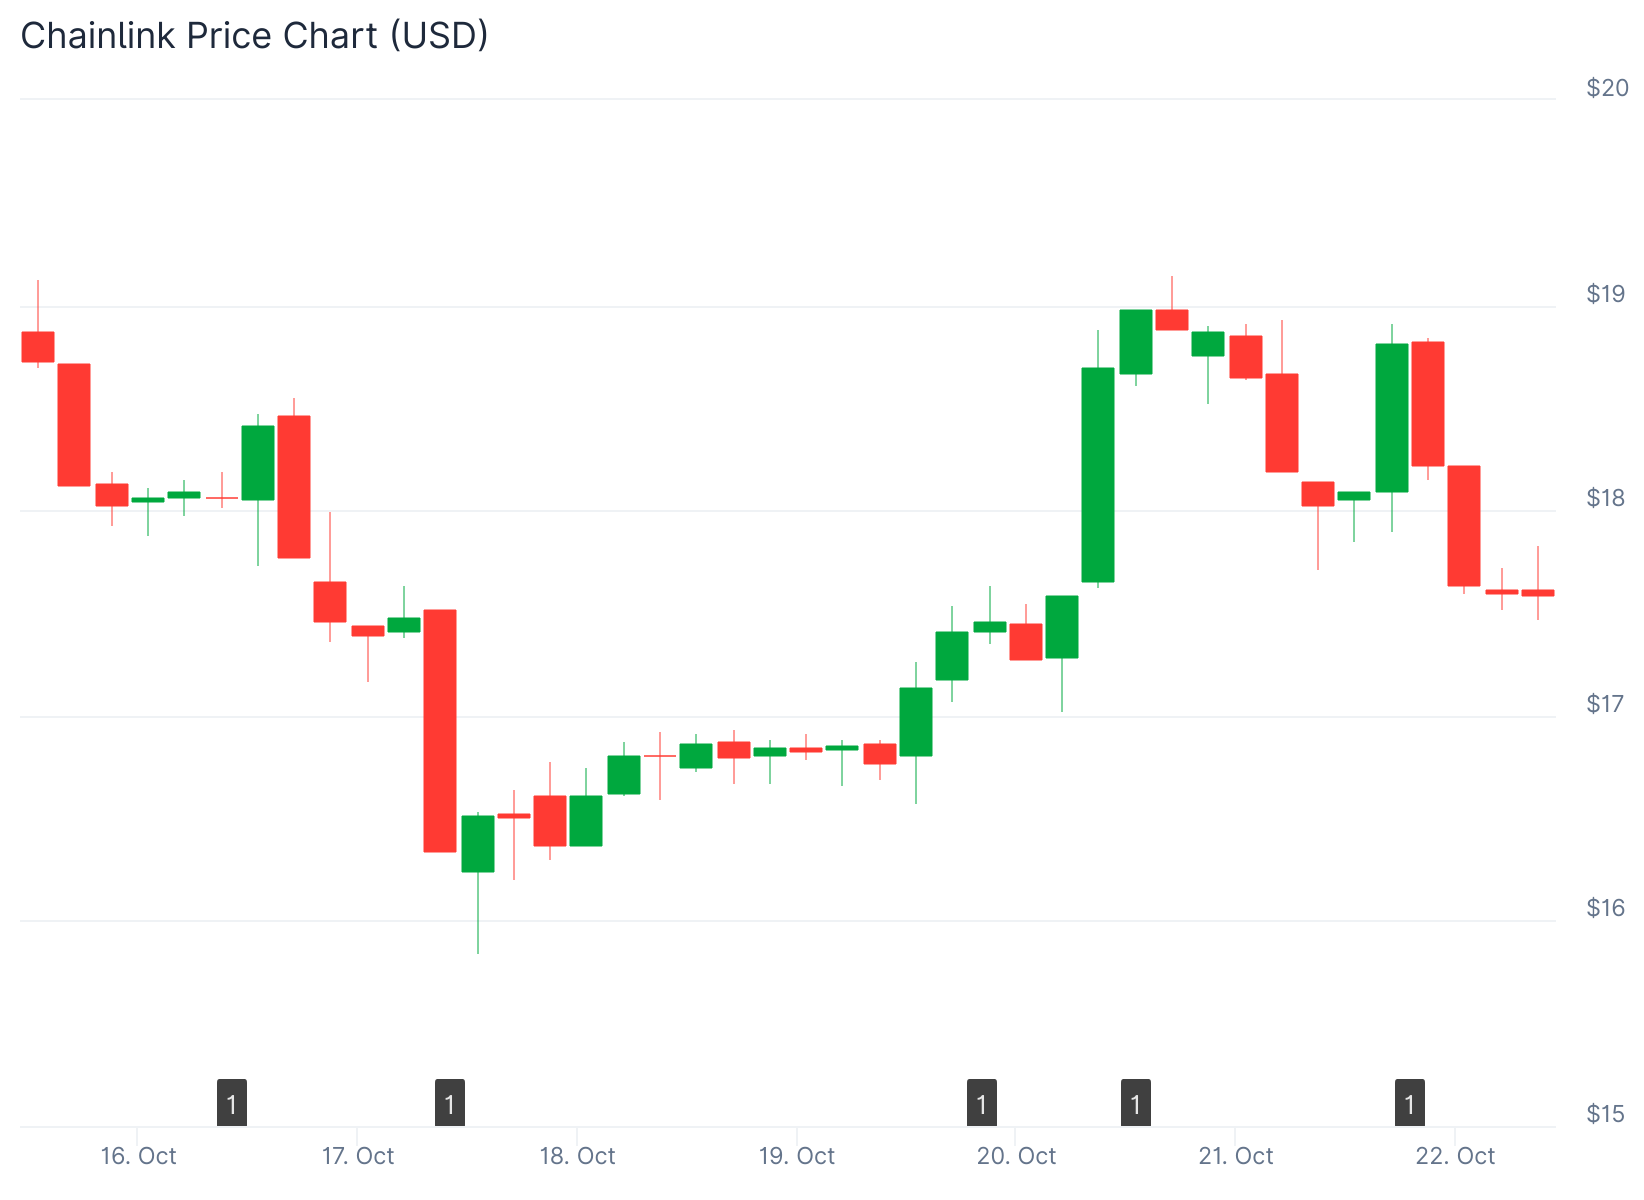
The $16 zone continues to attract buyer activity. This repeated defense shows growing confidence among investors who view this range as undervalued.
Large holders have accumulated roughly 54.47 million LINK tokens around the $16 price point. This buying activity reinforces the level as one of the strongest support zones based on blockchain data.
Historically, whale buying near this level has aligned with local price reversals. The consistency of these positions indicates growing belief in LINK’s ability to recover after each pullback.
Exchange flow data supports the bullish case. On October 21, LINK recorded net outflows totaling $16.57 million.
This marked one of the largest single-day exchange withdrawals in recent weeks. Such activity reflects decreasing supply on exchanges.
When fewer tokens remain available for sale, liquidity tightens. This condition typically precedes upward price pressure.

Technical Pattern Shows Potential Breakout
The daily chart shows LINK trading within a descending channel. Immediate resistance appears at $19.95, a level that has historically dictated the strength of previous uptrends.
Whenever LINK breached this threshold in the past, price acceleration followed. An analyst noted that Chainlink is tightening within a symmetrical triangle pattern formed since 2022.
This pattern suggests an anticipated breakout phase. The long-term price structure aligns with this formation, pointing to a sustained recovery if momentum holds.
A confirmed breakout above $19.95 could trigger a retest of $23.6. Continued strength might propel LINK toward $27 by December.
Multi-Year Triangle Approaches Decision Point
The triangle pattern doesn’t fit cleanly into standard categories. Its channel lies somewhere between an ascending triangle and a symmetrical triangle.
The next time Chainlink $LINK breaks $25, it could ignite a bull rally to $100. pic.twitter.com/fkWAPixjYs
— Ali (@ali_charts) October 20, 2025
The token retested the upper level of the triangle earlier this year and found rejection. LINK has been on the way down since then.
The chart shows LINK is slowly approaching the end of this multi-year channel. Breakouts become more likely the smaller an asset’s range gets.
The coin trades inside a narrow region now. A breakout could be coming closer.
A surge above a triangle is usually a bullish sign. A decline under the channel can lead to bearish action.
The next retest could set the tone for the coin’s upcoming price action. If the coin can break past the resistance line around $25, analysts think its price could see a bull rally.
One analyst has referred to the 1.272 Fibonacci Extension level as a potential target. This level sits around $100.
The steady formation of higher lows reinforces the bullish continuation outlook. Whale accumulation and exchange outflow trends highlight a synchronized pattern of confidence.
The $16 demand zone remains the backbone of LINK’s rebound structure. Continuous outflows confirm reduced supply pressure across exchanges.


