


TLDR
- LINK remains in a clear daily downtrend below a dominant descending trendline.
- Price is retesting the critical long-term $8.60–$9.00 demand zone.
- Loss of former $16 and $12 supports confirms sustained bearish control.
- Cyclical models suggest LINK remains in an extended corrective “winter” phase.
Chainlink (LINK) price is under renewed pressure as it retests a major long-term support zone following months of sustained downside momentum. Technical signals across multiple timeframes show weakening structure below former key levels, with price now trading near historically significant demand between $8.60 and $9.50. Analysts note that this zone could determine whether LINK stabilizes or remains locked in a broader corrective cycle.
Chainlink Price Daily Trend Remains Structurally Weak
According to analyst CRYPTOWZRD, the daily chart shows Chainlink price continuing to respect a dominant descending trendline that has guided the market since the macro peak near $27–$28. Every recovery attempt has stalled below this trendline, reinforcing a clear pattern of lower highs and sustained bearish control. This structure signals that sellers remain active on rallies, limiting upside follow-through.
 SOURCE: X
Moreover, several former reaction levels have failed to hold. The $16 and $12 zones, which previously acted as support and resistance pivots, have been decisively lost. Price has since accelerated lower toward the $9–$9.50 region, an area associated with prior demand. The speed of this decline suggests capitulation-style selling rather than gradual distribution.
From a technical perspective, the analyst highlighted that a daily close above the descending trendline is required to alter market structure. Until that occurs, the downtrend remains intact. Failure to defend the current support could expose Chainlink to further downside within its broader accumulation range.
Chainlink Price Tests Key Long-Term Support Zone
In the meantime, analyst Bitcoinsensus highlighted the importance of the $8.60–$9.00 zone on the higher-timeframe chart. This zone represents a critical support-resistance flip from the previous bear market range. Historically, it acted as a ceiling before eventually turning into support during the bullish expansion phase.
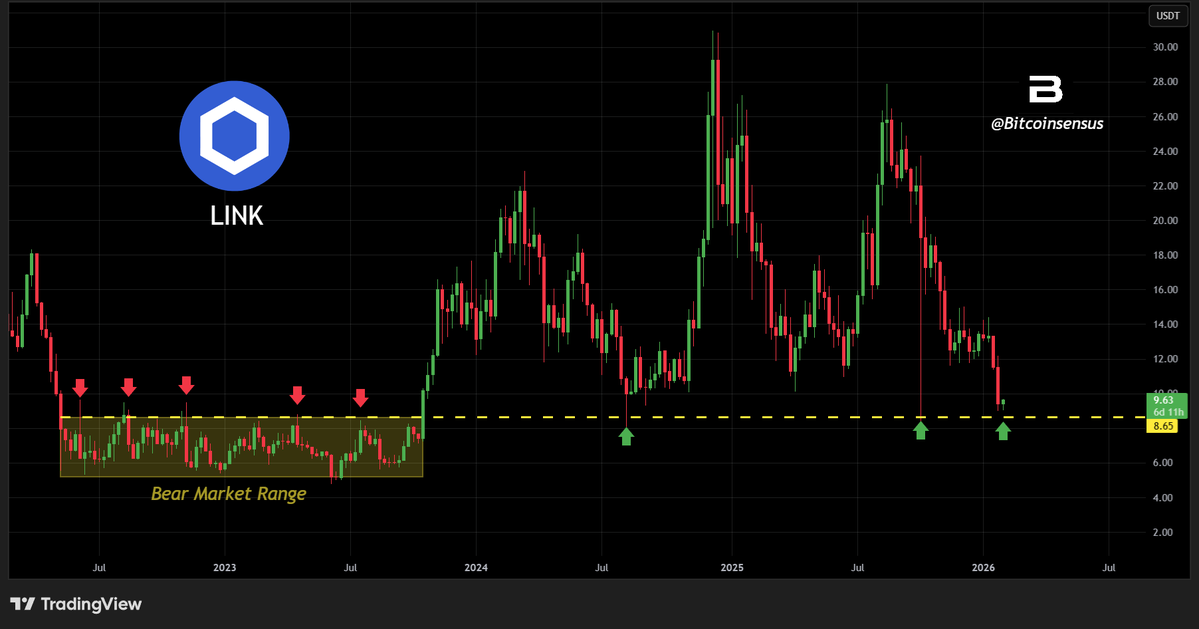

The current retest places the market at a pivotal decision point. Holding above this level would suggest that long-term participants are defending higher-range territory. Such behavior would support the idea of consolidation rather than a full structural breakdown. In contrast, acceptance below this zone would imply a return to the prior bear market range.
Additionally, the chart shows that previous reactions at this level produced meaningful rebounds. However, the absence of a strong bullish response so far raises caution. For now, Chainlink price remains balanced between potential stabilization and deeper corrective risk, with this zone acting as the primary reference for market participants.
LINK Price Cyclical Model Signals Extended Winter Phase
Furthermore, analyst MASTER presented a macro view based on seasonal cycle analysis. This framework categorizes Chainlink’s historical behavior into expansion and contraction phases. The current structure is positioned within a projected “winter” phase, following a failed attempt to sustain higher highs after the last expansion.
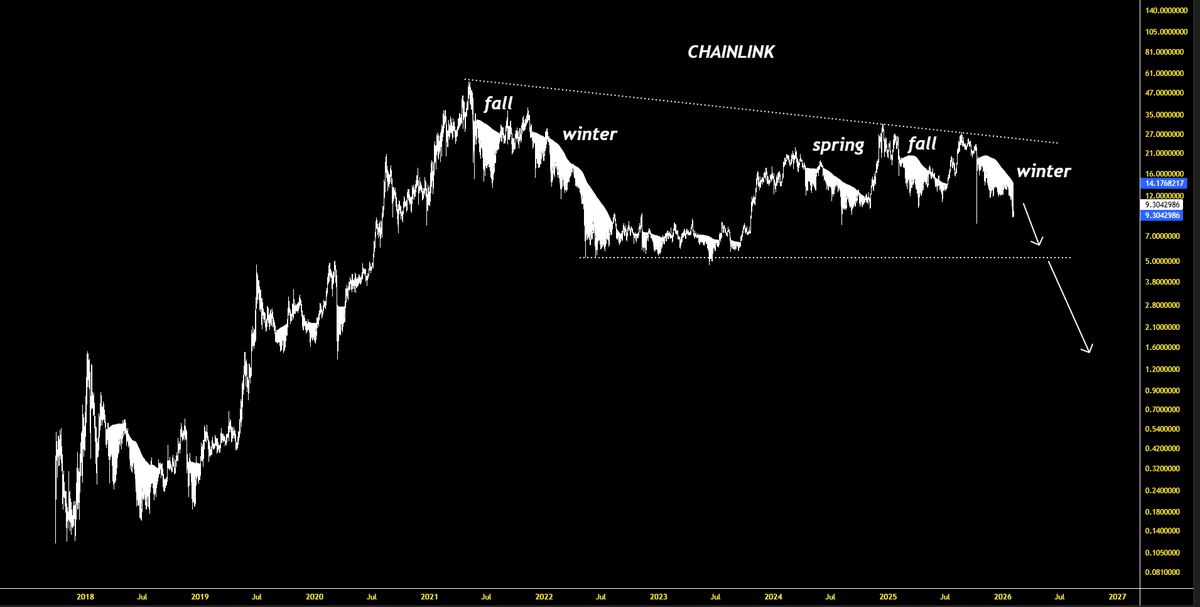
Price action during this phase shows repeated breakdowns after brief recoveries. According to the analysis, the early failure of a spring-like rebound often signals distribution rather than trend continuation. This aligns with the broader downtrend seen on daily and weekly charts.
From a cyclical standpoint, the model suggests that prolonged consolidation or additional downside may be required before a durable recovery emerges. While such frameworks are interpretive, they reinforce the defensive posture currently reflected in price behavior. As long as key support zones remain under pressure, Chainlink price continues to trade within a corrective macro environment.


