


TLDR
- XRP is holding key support at $2.85 while flashing a technical “buy” signal.
-
A move to $3.10 would confirm short-term upside before a push to $4.00.
-
The latest reversal pattern aligns with XRP’s historical bounce behavior.
-
Traders are watching daily closes above $2.85 and resistance near $3.10.
XRP is drawing fresh attention in crypto markets as new technical analysis signals a potential trend reversal. A series of price-based indicators and chart formations suggest that XRP could be preparing for a major move toward the $4.00 level.
As of this writing, XRP is trading around $2.90, slightly up in the last 24 hours. Technical traders are pointing to a pattern of support and resistance levels that may provide the framework for a bullish breakout. The key focus is on maintaining price strength above $2.85 while preparing for upward movement through $3.10 and beyond.
Technical Indicators Flash Buy as Reversal Signal Completes
According to one widely followed chartist on social media platform X, XRP may have completed a reversal signal known for triggering strong upward moves. The sequence in question—a nine-stage cycle from 1 to 9—last appeared ahead of XRP’s rise to previous local highs.
With signal “9” now complete and XRP holding steady near $2.90, the conditions are aligned for a breakout. Current trading patterns suggest buyers are entering at key support levels while sellers are showing signs of exhaustion. These factors contribute to an outlook that favors the bulls—if support remains intact.
- Source: X
The most immediate support for XRP is located at $2.85. Holding this level on a daily close basis is considered essential for keeping the current bullish structure intact. From a resistance standpoint, the next key zone is between $3.00 and $3.10.
If XRP manages to clear this range with convincing volume, analysts expect momentum could carry the price toward $4.00. A move from $2.90 to $4.00 would represent a 37% gain. Traders are closely monitoring daily candle patterns and volume surges that could confirm this momentum shift.
Broader Technical Context and Risk Zones
Further technical analysis also outlines longer-term price zones that traders are watching.

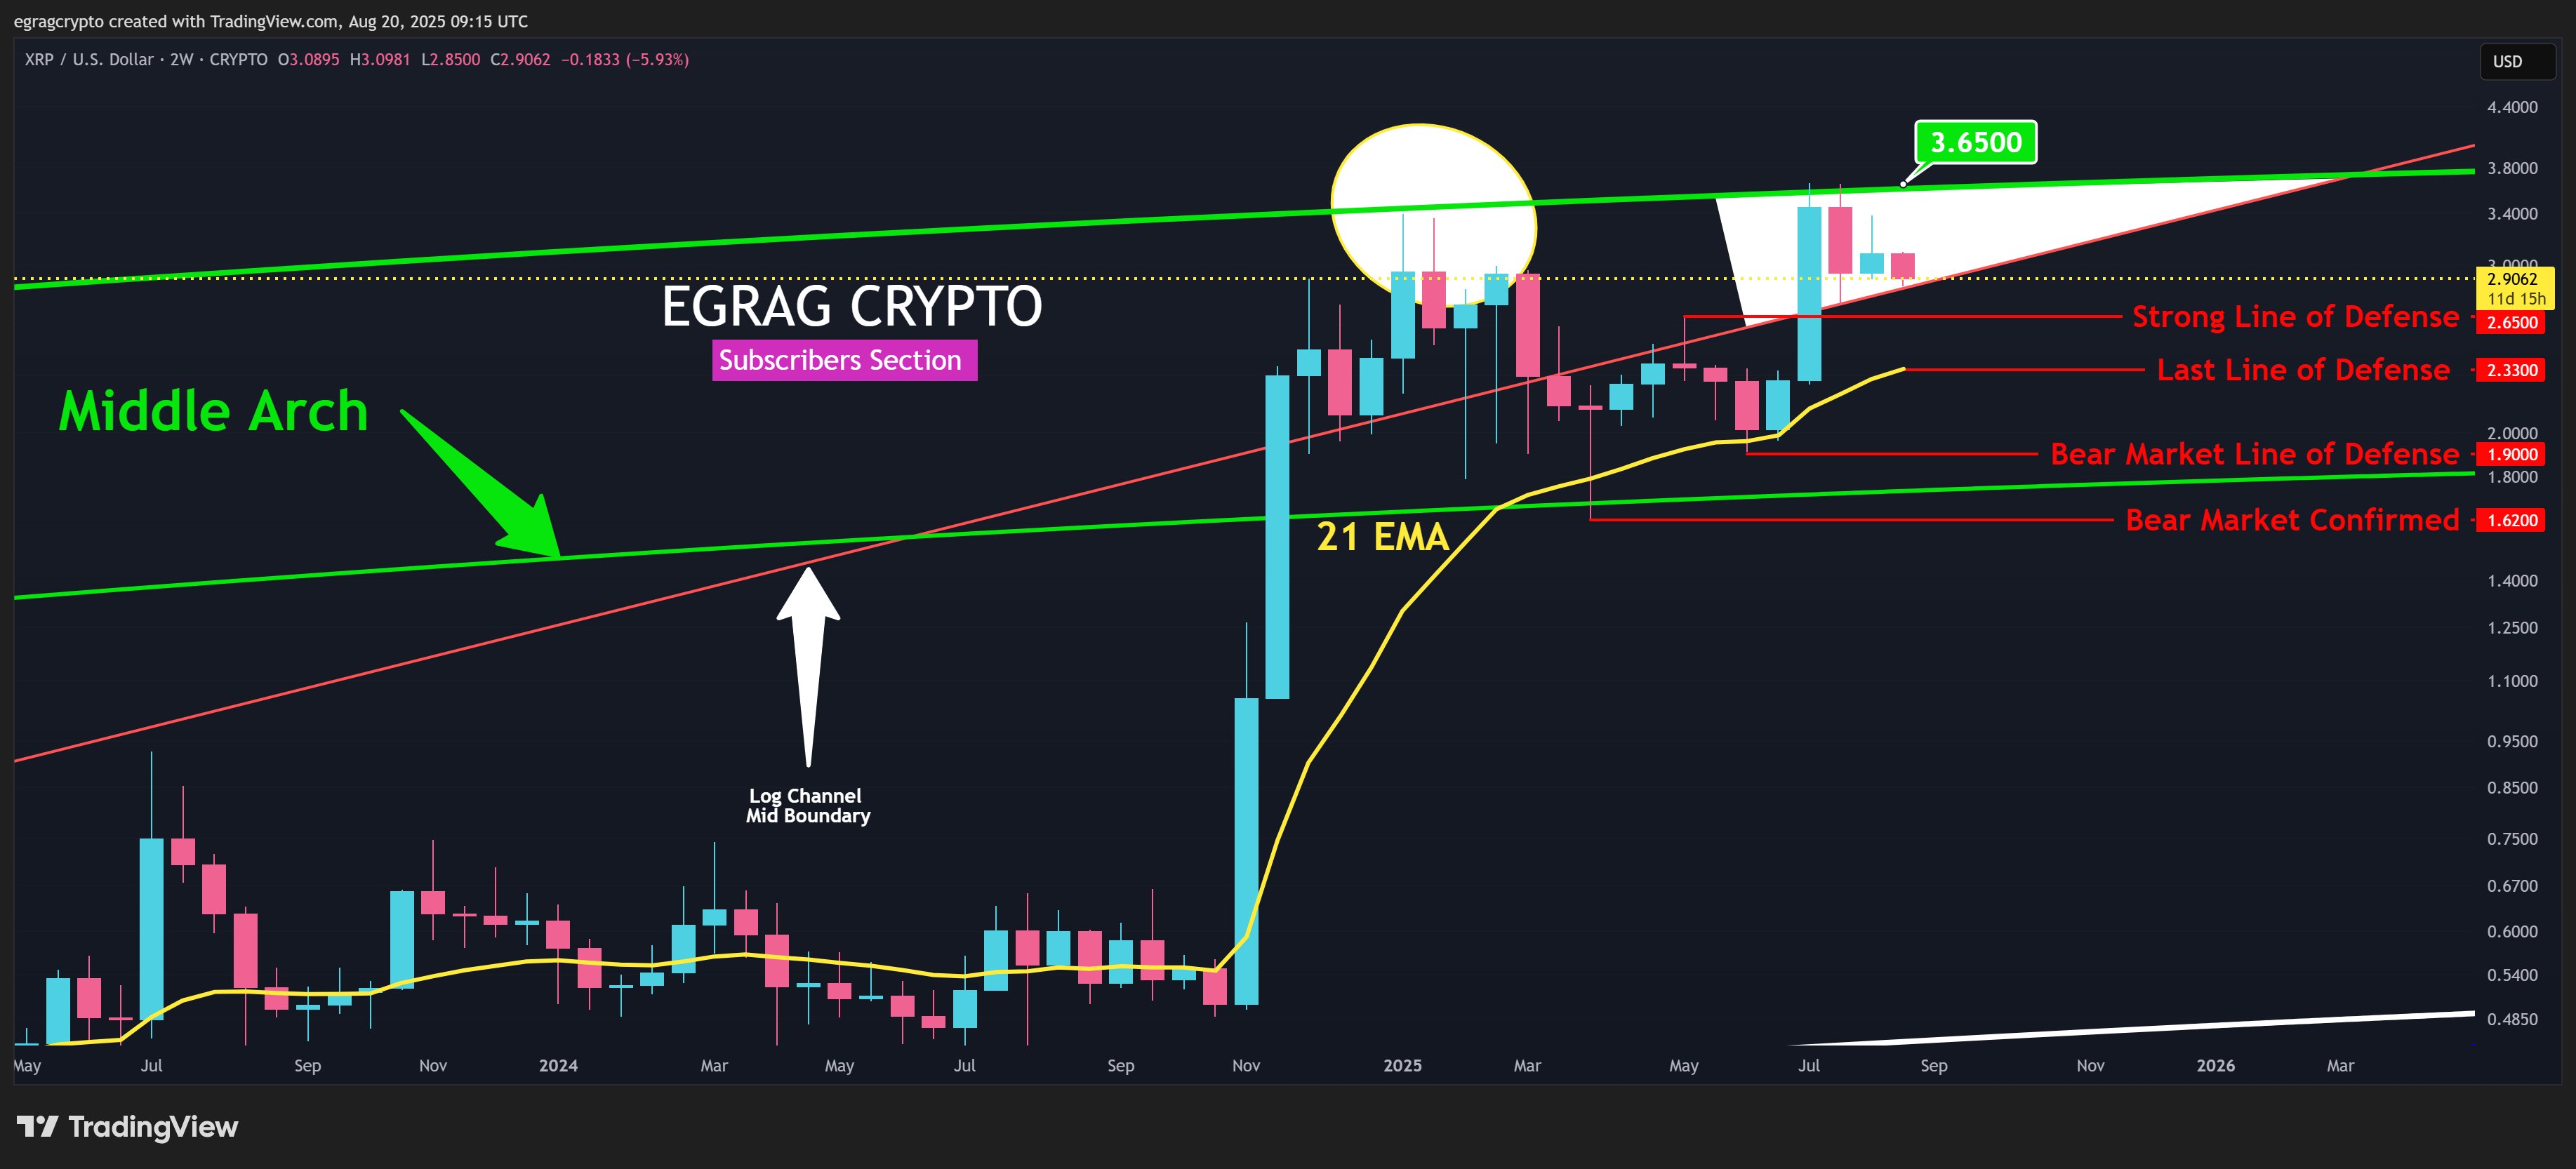
A popular chart from @egragcrypto identifies $2.90 as the midpoint of XRP’s current Linear Log Channel. Closing above this level keeps XRP in bullish territory.
Additional support is marked at $2.65 and $2.33, with $1.90 identified as the longer-term bear market threshold. According to the same analysis, $3.65 is a key trigger point that could push XRP into a new price discovery phase if cleared.
XRP Trading Outlook and Market Behavior
While Bitcoin and Ethereum remain in focus for many traders, XRP’s structure is attracting growing attention due to its technical clarity. The bullish setup depends on holding above key support and advancing past the resistance levels with increasing volume.
Consequently, per the analysts, the XRP price has strength above $2.85, volume patterns near $3.10, and continuation moves toward $4.00. If this setup follows historical behavior, XRP could deliver one of its strongest technical plays of the year.


