


 Price: $200M Whale Transfer Sparks Selling Fears")
TLDR
- A whale transferred 900 million DOGE ($200+ million) to Binance, causing brief selling pressure and price drop from $0.25 to $0.23
- Despite transfers, whales accumulated 680 million DOGE in August, showing mixed signals between buying and selling
- DOGE trades in tight range near $0.22 with support at $0.219-$0.220 and resistance at $0.224-$0.225
- Technical analysts identify multiple bullish patterns including triangle, cup-and-handle, and rounding bottom formations
- Key resistance level sits at $0.29 with potential targets up to $0.80 if breakout occurs
Dogecoin price movements have captured trader attention as large holders shift positions while technical patterns suggest potential breakout conditions. The meme coin currently trades around $0.21-$0.22 after recent whale activity created short-term volatility.
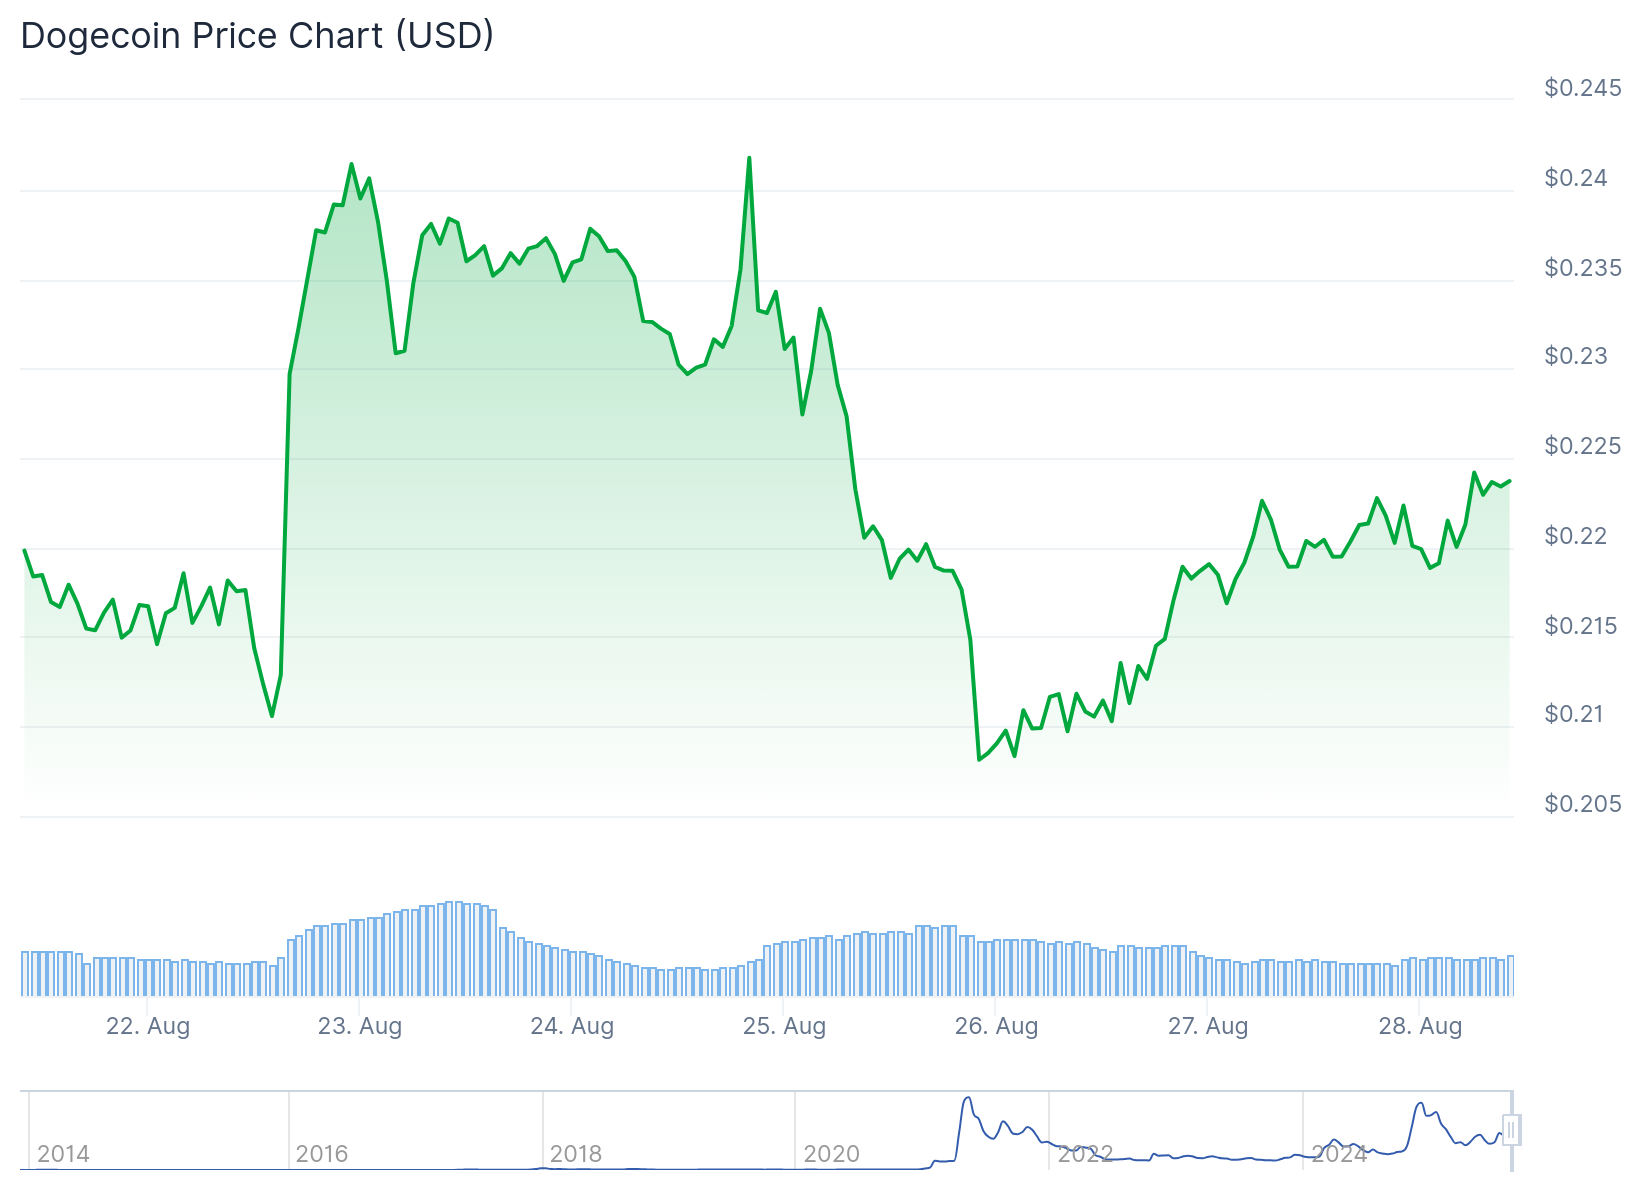
Between August 24-25, a single whale moved 900 million DOGE tokens worth over $200 million to Binance exchange wallets. This transfer sparked immediate selling fears among traders. Prices dropped from $0.25 to test $0.23 support levels on higher than normal trading volumes.
The whale transfer represents one of the largest single movements recorded in recent months. Market participants often view large exchange deposits as bearish signals since they typically precede selling activity.
However, on-chain data reveals a more complex picture. Whale addresses accumulated 680 million DOGE tokens throughout August despite the high-profile transfer. This creates a tug-of-war dynamic between distribution and accumulation activities.
Futures market positioning weakened following the whale transfer. Open interest declined 8% as traders reduced speculative leverage positions. This reduction in derivatives activity has lowered immediate volatility but also tempered breakout conviction among market participants.
From August 27 to August 28, DOGE maintained a narrow $0.01 trading range around the $0.22 level. The token showed resilience by holding key support zones despite selling pressure from large holders.
Dogecoin Price Prediction
Multiple analysts have identified bullish chart formations developing on DOGE price charts. Analyst Zeinab highlighted a rounding bottom pattern, which often precedes new uptrend development. She also noted triangle formation indicating falling volatility before potential breakouts.

$DOGE is showing a pattern similar to 2024. It’s forming a rounding bottom & if it breaks $0.29, it could rally like last time from $0.18 to $0.49.
A converging triangle is also forming, which means a breakout might be coming.
If the pattern repeats, we could reach $0.80 in Q4. pic.twitter.com/ZhUQ8LRyGf
— Crypto Zeinab (@CryptoZeinab) August 20, 2025
The triangle pattern shows converging price action as trading ranges narrow over time. This compression phase typically resolves with directional moves once the pattern completes.
Zeinab identified $0.29 as the primary resistance level traders should monitor. A clear break above this zone could mirror earlier price action when DOGE advanced from $0.18 to $0.49. Extended momentum could target $0.80 by the fourth quarter of 2025 according to her analysis.
Analyst Cryptoinsightuk focused on shorter-term opportunities for active traders. He calculated a risk-to-reward ratio of 6.5 for current price levels. Ratios above 5 are generally considered attractive for swing trading strategies.
A lot of crypto setting up similarly here.
Take $DOGE for example.
Highs swept.
Lows swept.
Now decent 4HR volume and potential to see RSI cross bullish from near oversold levels.
This offers a nice 6.5 R/R ST trade set up.
NB I am not taking this trade, I'm already in a… https://t.co/rlYFrVopqJ pic.twitter.com/eByVjZIKo6
— Cryptoinsightuk (@Cryptoinsightuk) August 20, 2025
The Relative Strength Index turned upward after reaching oversold territory below 30. RSI currently approaches the midpoint around 50, indicating improving momentum conditions. This technical indicator measures price move strength on a 0-100 scale.
Market Structure and Volume Analysis
Peak institutional participation occurred at 20:00 GMT on August 27. DOGE advanced from $0.219 to $0.224 on 1.26 billion token volume, nearly four times the hourly average. This spike suggests corporate treasury desks may be positioning ahead of broader market catalysts.
Strong bid interest has emerged around the $0.219-$0.220 zone, establishing this area as the new price floor. Support between $0.19-$0.20 provides additional downside protection according to analyst Andrew Griffiths.
Griffiths identified a cup-and-handle formation developing on longer-term charts. This bullish pattern consists of a rounded base followed by smaller pullback before potential breakout moves.
Multiple technical signals align including the rounding bottom, triangle convergence, and cup-and-handle patterns. Analysts said momentum indicators and volume trends will determine whether DOGE can advance toward higher levels.
At press time, DOGE trades around $0.21 with a market capitalization near $33 billion. Daily trading volume approaches $3.4 billion. The token gained 2.3% in 24 hours but declined 4.4% over the past week and 17% monthly.
The all-time high remains at $0.7375 reached during previous bull market conditions. Current price levels represent roughly 72% below peak values despite recent technical pattern development.


