


 Price: Bollinger Band Squeeze Points to a Big Move Coming")


TLDR
- DOGE is trading below $0.0900, under pressure from the descending 50-day EMA
- Derivatives data shows negative funding rates and short-side dominance
- Key support sits at $0.0879 — a close below could push DOGE toward $0.0800
- Bulls need to clear $0.0930 to target $0.10; failure could see a drop to $0.0835
- Bollinger Bands are squeezing on the daily chart, pointing to a big move ahead
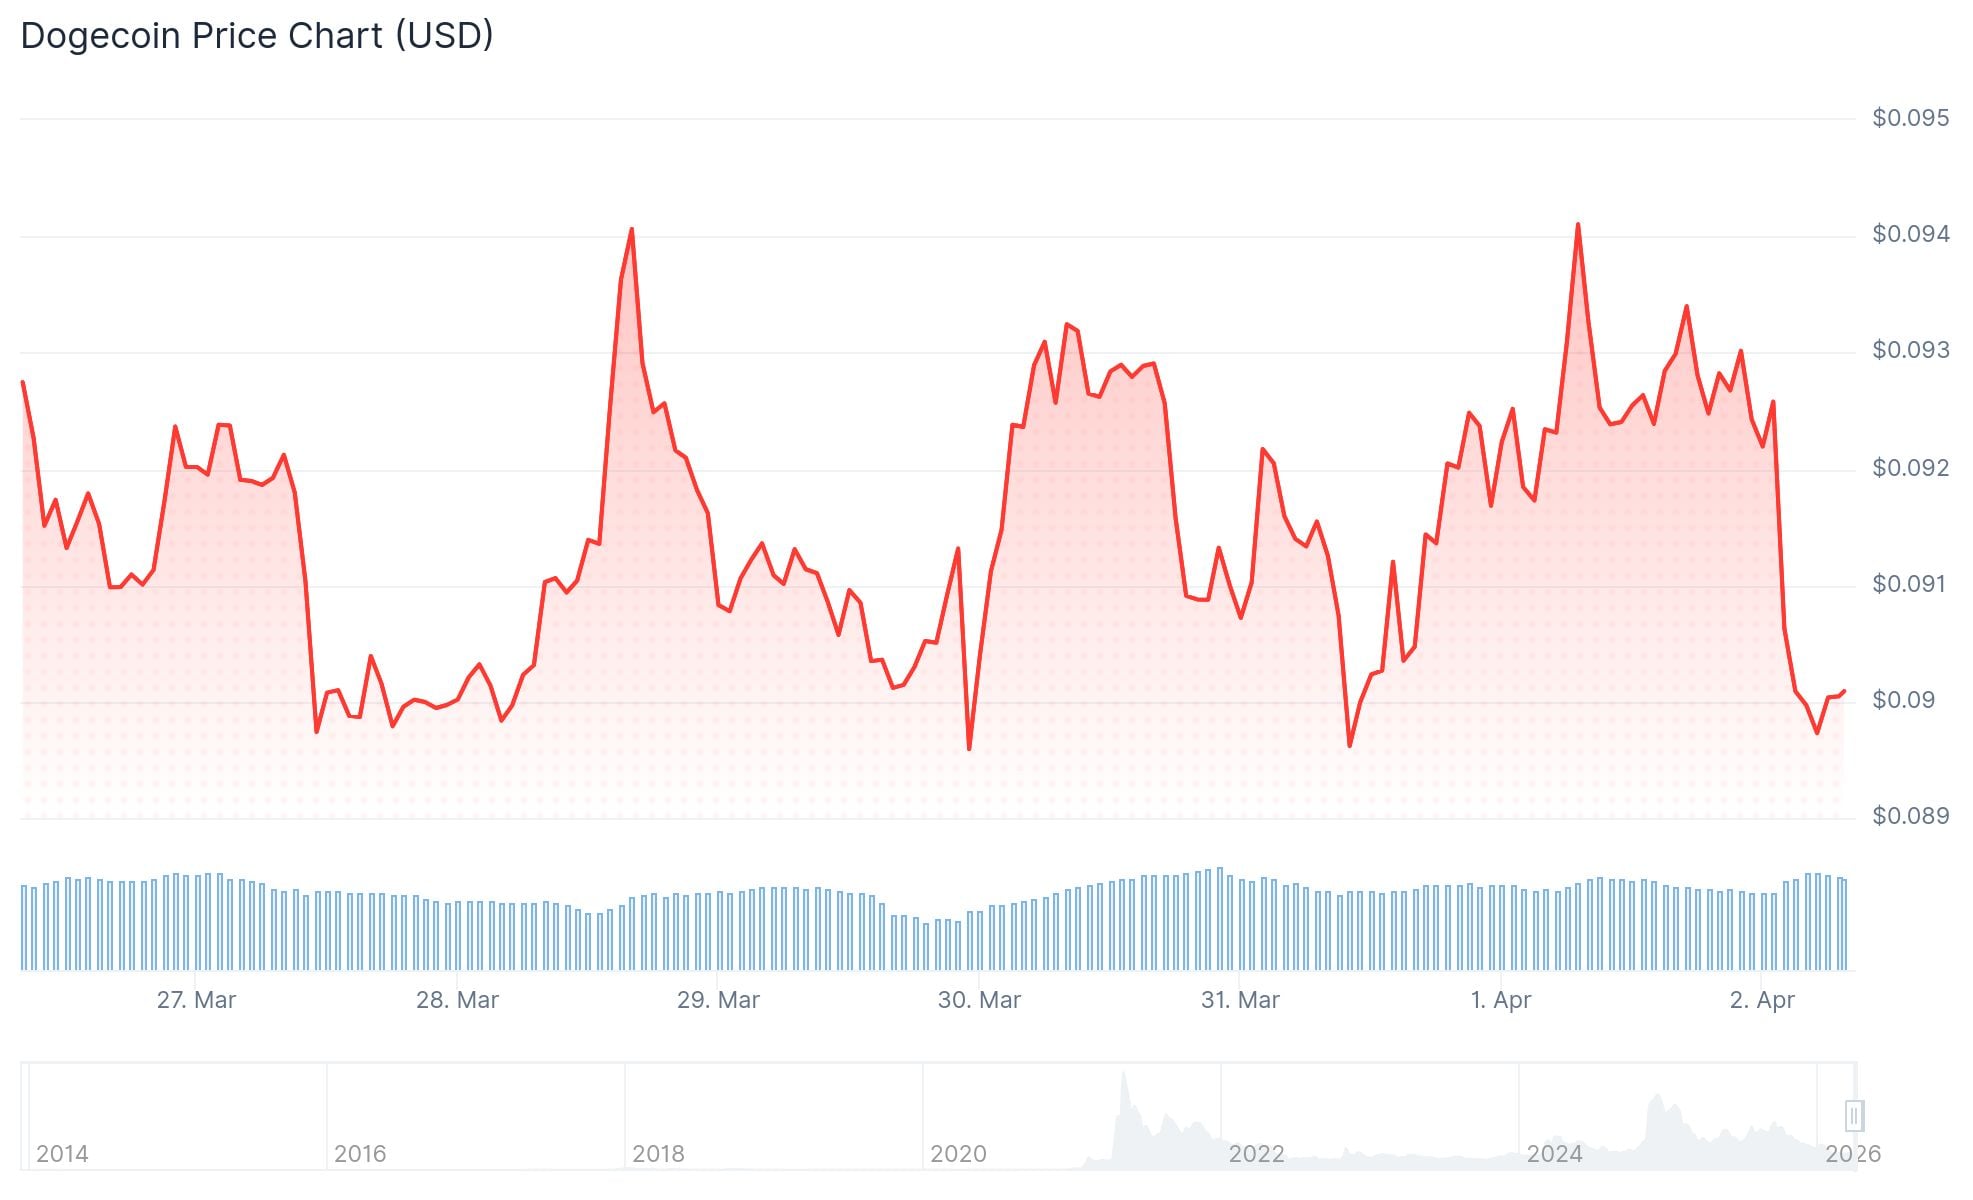
Dogecoin is trading at around $0.0926 at the time of writing, up 2.28% in the past 24 hours, but sellers continue to defend the $0.0930 resistance zone. The meme coin has been caught between a modest recovery attempt and persistent bearish pressure, leaving traders watching a tight range for the next clear signal.
DOGE dropped to a low of $0.0890 before buyers stepped in. The rebound pushed price above $0.0905, $0.0912, and $0.0920 in successive steps. That move cleared the 50% Fibonacci retracement level of the decline from $0.0937 to $0.0893.
A bearish trend line is forming on the hourly chart, with resistance pinned at $0.0928. The 76.4% Fibonacci retracement level sits near this same zone, reinforcing the barrier. Bears have repeatedly defended this area.
The price is holding above $0.0912 and the 100-hourly simple moving average. This keeps the short-term structure cautiously bullish, though only by a slim margin.
Derivatives Paint a Bearish Picture
Dogecoin derivatives data reflects bearish sentiment. According to CoinGlass, DOGE futures Open Interest stands at $1.05 billion, down 0.81% in 24 hours. There were $4.55 million in liquidations during the same period, with $3.48 million coming from long positions.
The long-to-short ratio of active DOGE positions sits at 0.967, meaning more traders are holding short positions than long. The funding rate has dropped to -0.0097%, confirming traders are paying a premium to stay short.
Bollinger Bands are squeezing on Dogecoin $DOGE daily chart, suggesting a major price move could be coming soon. pic.twitter.com/AO6dfMzKkE
— Ali Charts (@alicharts) April 1, 2026

Analyst Ali Charts posted on X, noting that Bollinger Bands are squeezing on the Dogecoin daily chart. He stated this suggests a major price move could be coming soon, though the direction was not specified.
Key Levels to Watch
On the upside, DOGE needs a clear break above $0.0928–$0.0930 to open a path toward $0.0950, then $0.0980. A move past $0.0980 would bring the $0.10 level into focus, with $0.1020 as the next target beyond that.
$DOGE is gathering energy at the bottom of the rising channel.
It is still located at the starting line, and a rally will begin soon. pic.twitter.com/gCoo4yLn7T
— CW (@CW8900) April 1, 2026
The 50-day and 100-day EMAs sit at $0.0974 and $0.1107, acting as overhead resistance levels.
On the downside, $0.0915 is the first line of defense. Below that, $0.0900 is a critical threshold. A daily close below $0.0879, the February 11 low, could push DOGE toward $0.0800 and potentially $0.0741.
The RSI on the hourly chart holds above 50, and the MACD remains in bullish territory but is losing momentum. On the daily chart, the RSI sits near 43, below the midline, reflecting a mild bearish bias.
The most recent price action shows DOGE holding above short-term support at $0.0912, with the $0.0930 resistance level remaining the key hurdle for bulls heading into the next trading session.


