


 Price: Bulls Hold Support as Whale Buying and Reversal Signal Emerge")


TLDR
- DOGE dropped below $0.1025 and is now holding support near $0.0980
- A bullish Heikin Ashi green candle appeared at around $0.095, a signal traders watch for reversals
- Trading volume rose 13% to $2.03 billion, with large holders increasing their positions
- Resistance levels to watch are $0.1015, $0.1040, $0.1080, and $0.1120
- A break below $0.0950 could push DOGE toward $0.0880
Dogecoin pulled back from recent highs and is now testing a key support zone. Traders are watching whether bulls can hold the floor and push the price higher.
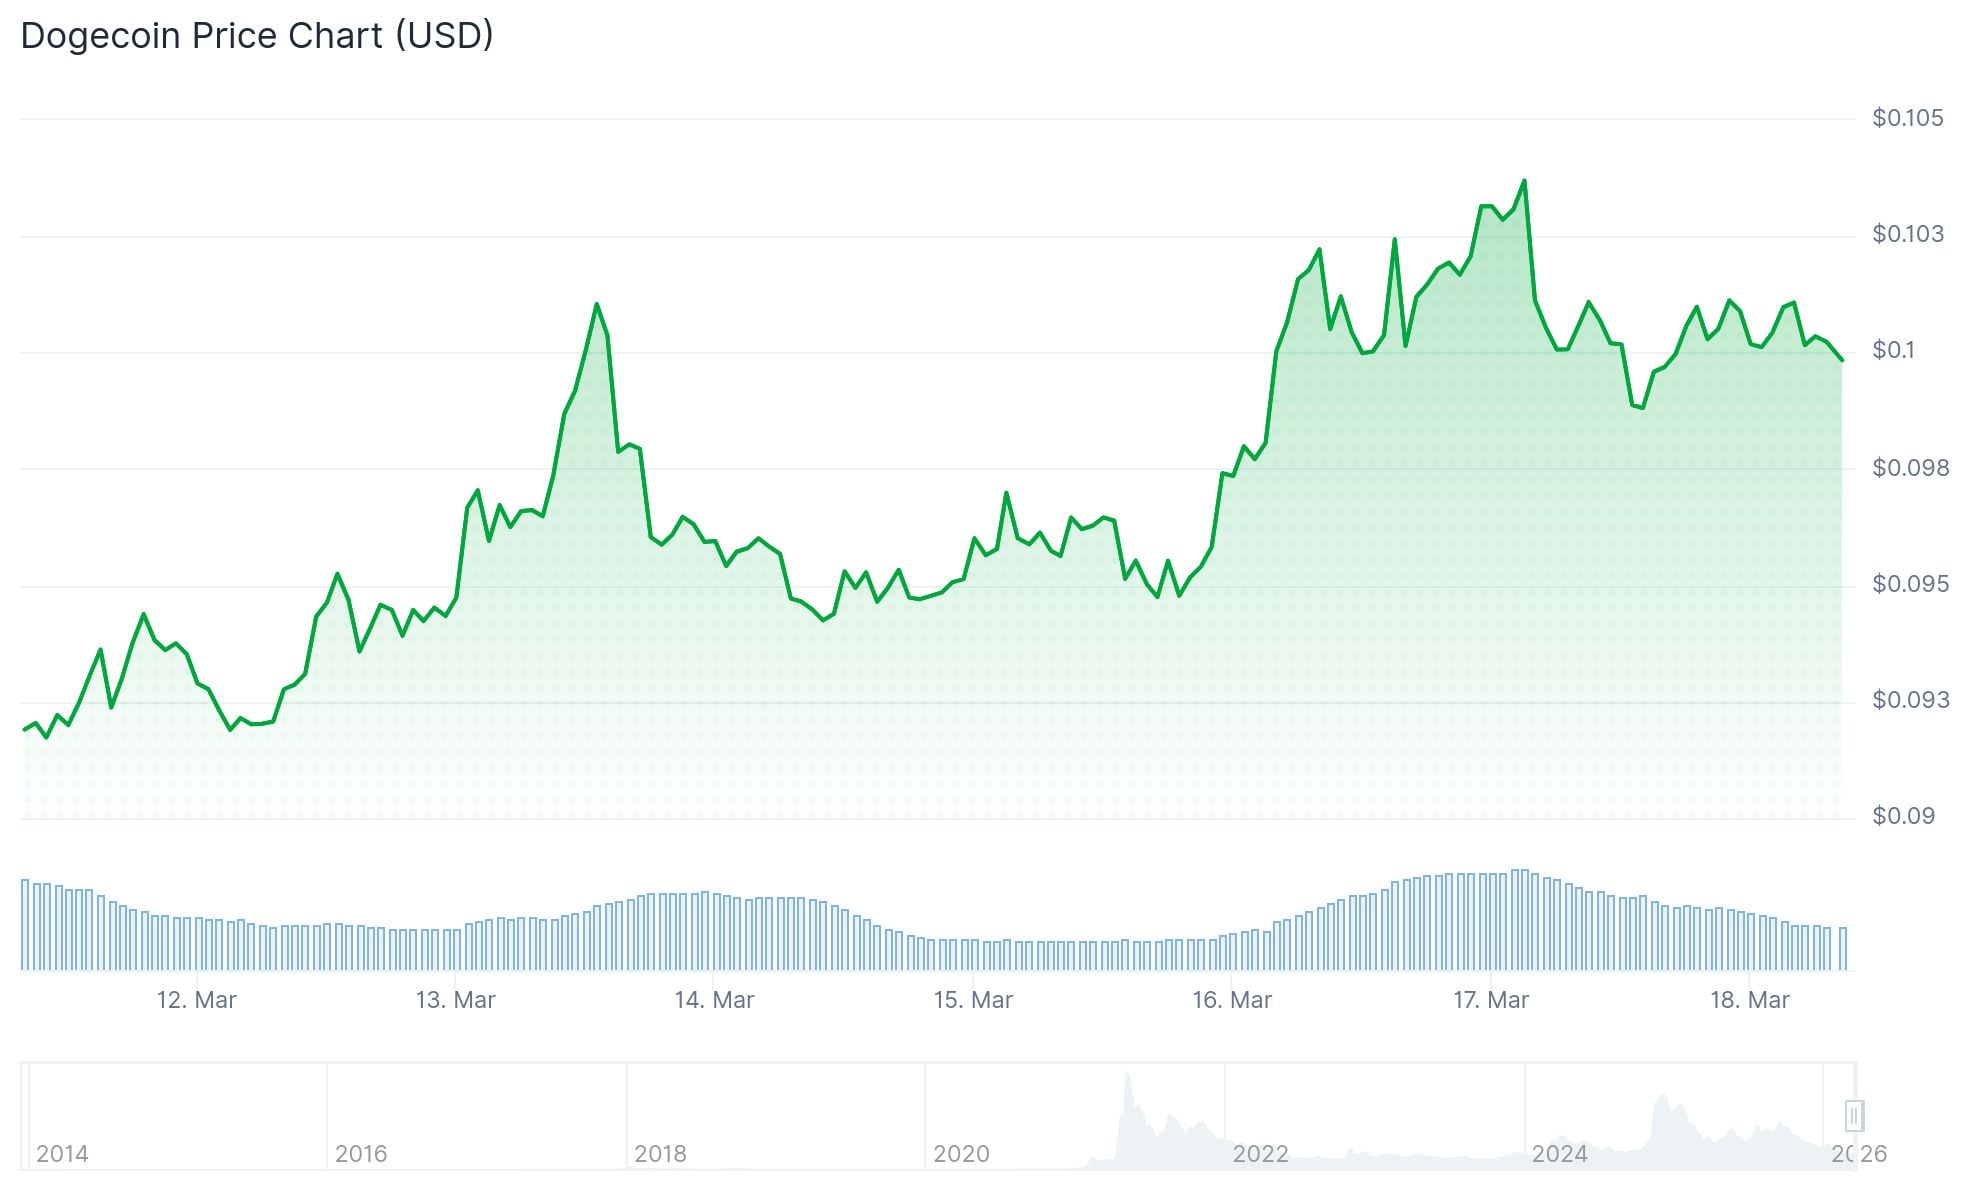
DOGE failed to hold above $0.1025 and slid below $0.1010. The drop took it briefly under $0.10 before buyers stepped in.
The price settled above $0.0980 and the 100-hourly simple moving average. A bullish trend line is forming on the hourly chart with support around $0.0968.
DOGE is currently trading near $0.1009. Over recent sessions, the price has moved between $0.099 and $0.104.
The Heikin Ashi indicator — which smooths out price data to filter noise — flipped to a green candle at around $0.095. Traders use this shift as a sign that selling pressure may be easing.
Whale Activity and Volume Pick Up
Total trading volume climbed 13% to $2.03 billion. At the same time, large wallet holders — often called whales — have been adding to their positions.
470 million Dogecoin $DOGE have been bought by whales in the last 72 hours. pic.twitter.com/0j5dPtadp1
— Ali Charts (@alicharts) March 16, 2026

High-volume accumulation by large holders often signals growing confidence in a price floor. When whales buy, smaller traders tend to follow.
The drop from the recent high of $0.1044 to the current range represents a 50% Fibonacci retracement of the move up from $0.0944. That level is a common technical reference point traders use to gauge corrections.
Key Levels to Watch
On the upside, the first resistance sits at $0.1015. A break above that could open the door to $0.1040, then $0.1080.
A Heikin Ashi green candle has appeared for $DOGE.
The trend has reversed after touching the bottom line.
The real rally for $DOGE is beginning. pic.twitter.com/b9Exz7kpyG
— CW (@CW8900) March 17, 2026
A close above $0.1080 would put $0.1120 in play. Further gains could target $0.1150 and then $0.120.
If DOGE fails to clear $0.1015, the downside support levels are $0.0980, $0.0968, and then $0.0950.
A break below $0.0950 would be a bearish signal. That could send the price toward $0.0880.
The 76.4% Fibonacci retracement level near $0.0968 is the next major support after $0.0980. That level lines up with the bullish trend line on the hourly chart.
Heikin Ashi patterns similar to the current one appeared during earlier DOGE rallies, including a run in 2021 when the price moved up from $0.05.
DOGE is currently above $0.10, holding above both the trend line support and the 100-hourly moving average.


