


 Price: Can DOGE Really Double From Here? The Chart Says It’s Possible")


TLDR
- Dogecoin is trading around $0.10, with bulls targeting a move to $0.20
- A cup-and-handle pattern is forming on the chart, a setup that often precedes a breakout
- RSI sits near 52 and Chaikin Money Flow at 0.04, both pointing to neutral-to-light accumulation
- DOGE has tested a descending trendline for six straight daily candles without breaking below it
- A drop below $0.10 could push DOGE toward the $0.09 support level
Dogecoin is hovering just above $0.10 as traders watch for signs of a breakout. The meme coin has been trading sideways for several weeks, but technical patterns and broader market conditions are drawing renewed attention.
DOGE is currently up about 3% over the past 24 hours. While that’s a modest move, analysts say the setup on the chart could lead to a larger run this month.
One pattern drawing attention is a cup-and-handle formation on the daily chart. This is a classic bullish setup where price forms a rounded bottom, then pulls back slightly before breaking higher.
$Doge/daily
A classic bullish pattern that typically leads to a breakout – Cup and Handle 👀
✍️ #Dogecoin has etched a tidy cup pattern and is now shaping the handle. https://t.co/rb1LaR5V3D pic.twitter.com/cWqxbjtBty
— Trader Tardigrade (@TATrader_Alan) February 21, 2026
The handle phase appears to be forming now. If buyers stay in control, a breakout above $0.12 could be the first step toward higher targets.
From $0.12, the next level to watch is $0.15, which has acted as resistance in past rallies. A clean break above that zone could open a path toward $0.20, which would represent a gain of over 100% from current prices.
Momentum Indicators Are Neutral
The Relative Strength Index is sitting near 52. That’s in neutral territory, meaning the token is neither overbought nor oversold. It’s been ticking slightly higher, which suggests new buying interest is starting to build.

$DOGE/daily
Trendline holding ✅ but momentum weak ⚠️#Dogecoin has tested the trendline 6 daily candles in a row, trying to break below it. It’s still holding above the descending trendline — structure remains bullish 🔥
Still, this pop looks like it’s running on fumes. Price… https://t.co/ZtxMVeZnXF pic.twitter.com/Dh8Ap6blJT
— Trader Tardigrade (@TATrader_Alan) February 22, 2026
The Chaikin Money Flow reading is around 0.04. That indicates light accumulation, not a flood of capital, but a quiet return of buying pressure after a slow period.
DOGE has also been testing a descending trendline on the daily chart for six consecutive candles. It has held above that line each time, which analysts say keeps the bullish structure intact.
However, the rally lacks strong conviction so far. Analysts note that trading volume has not surged to levels typically seen before a major breakout. Without that volume, any upward move may be short-lived.
Broader Market Conditions Supportive
The total crypto market cap rose 1.88% to $2.35 trillion in the past day. Spot ETF inflows came in at around $9.05 million, adding a layer of institutional interest to the market.
Other meme coins including SHIB, PEPE, BONK, and Pengu have also seen gains, with the total meme coin market cap sitting near $35.3 billion after a 2.3% daily increase.
On-chain data shows whale accumulation is picking up and active addresses are growing. These are early signals that sentiment may be shifting.
The key level to protect on the downside is $0.10. A close below that could bring $0.09 into play, which is the next major support on the chart.
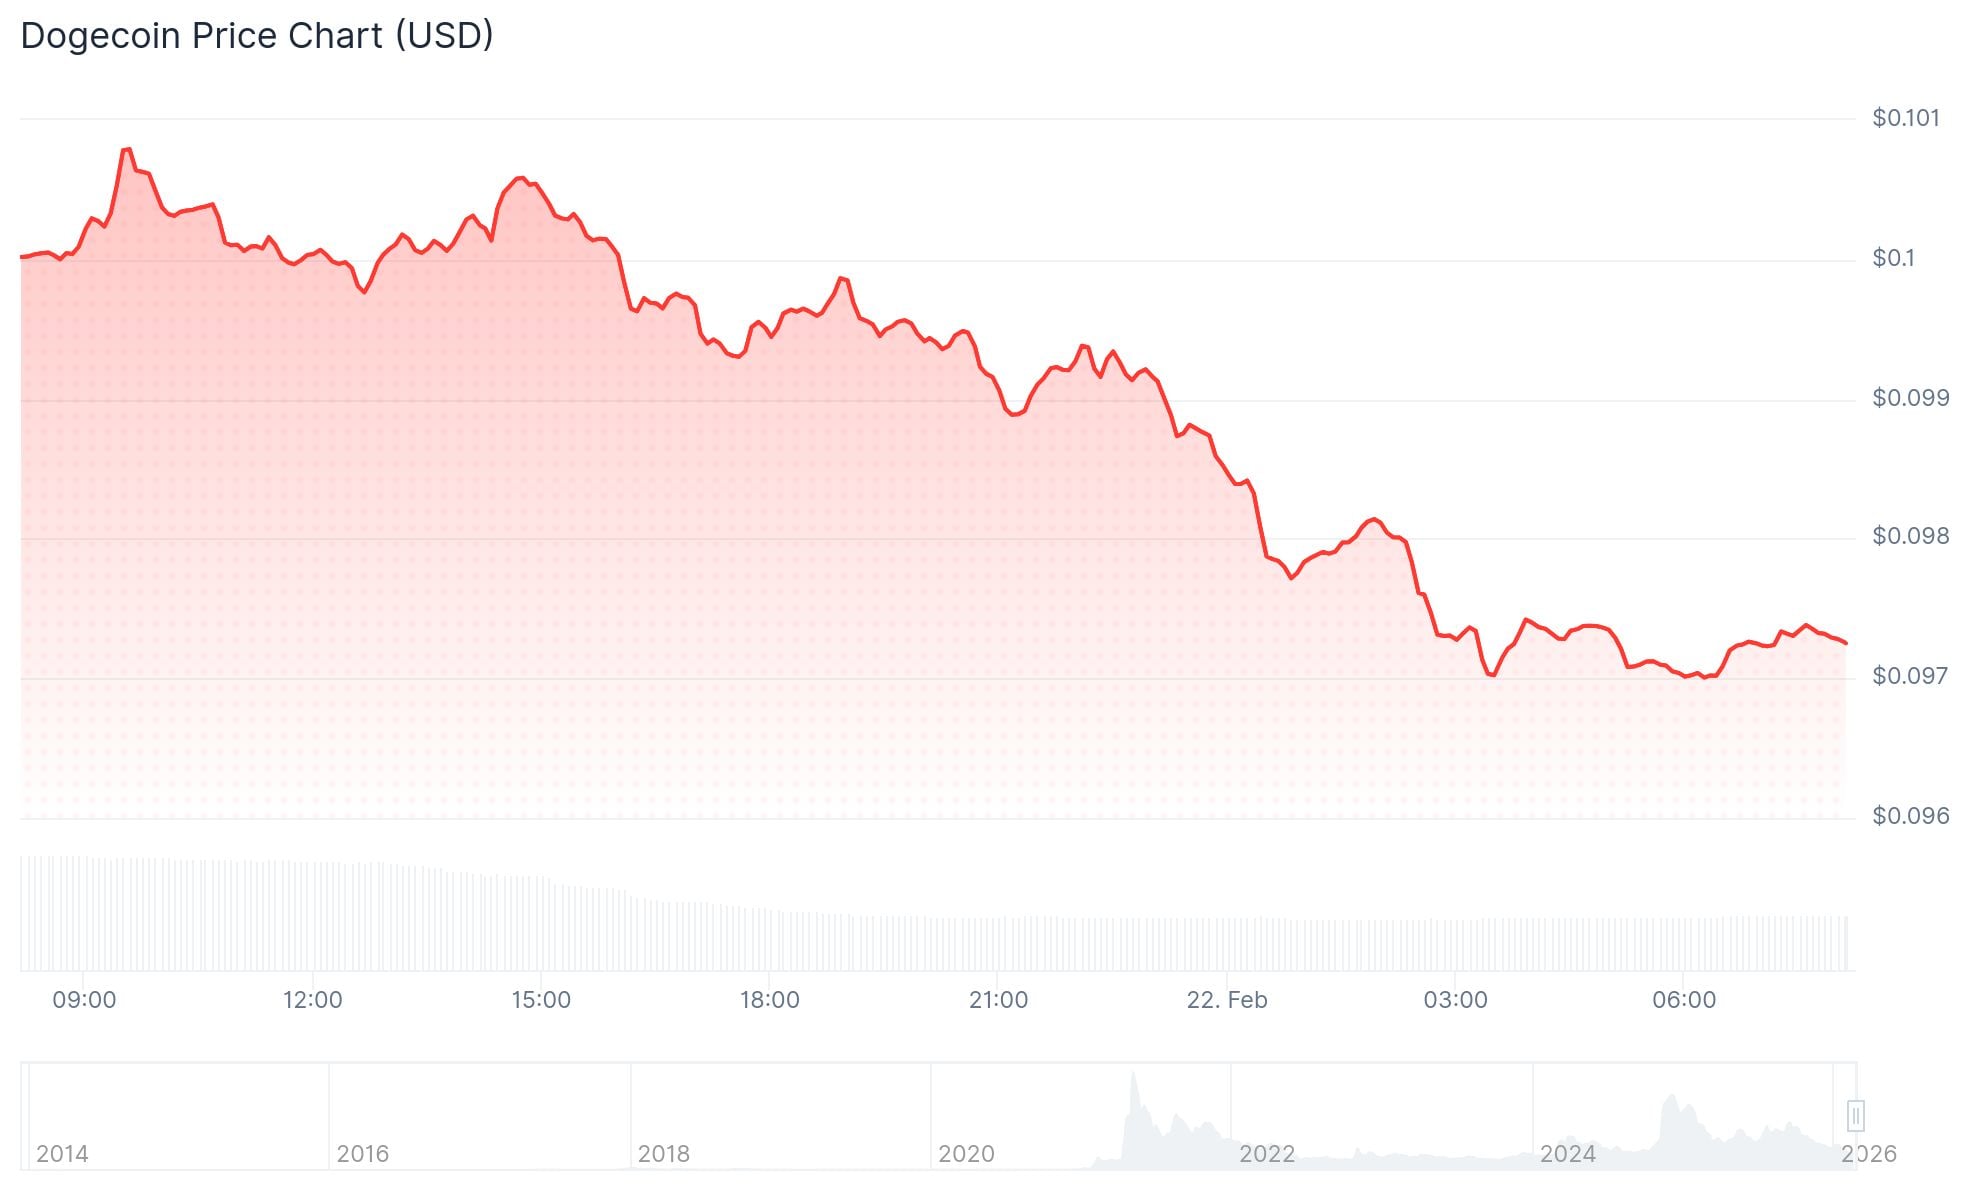
As of the latest data, DOGE is trading at approximately $0.097, holding just under the $0.10 mark while traders wait for a volume-backed move to confirm the next direction.


