


 Price: Double Bottom Pattern Points to $0.33 Target as Volume Surges")


TLDR
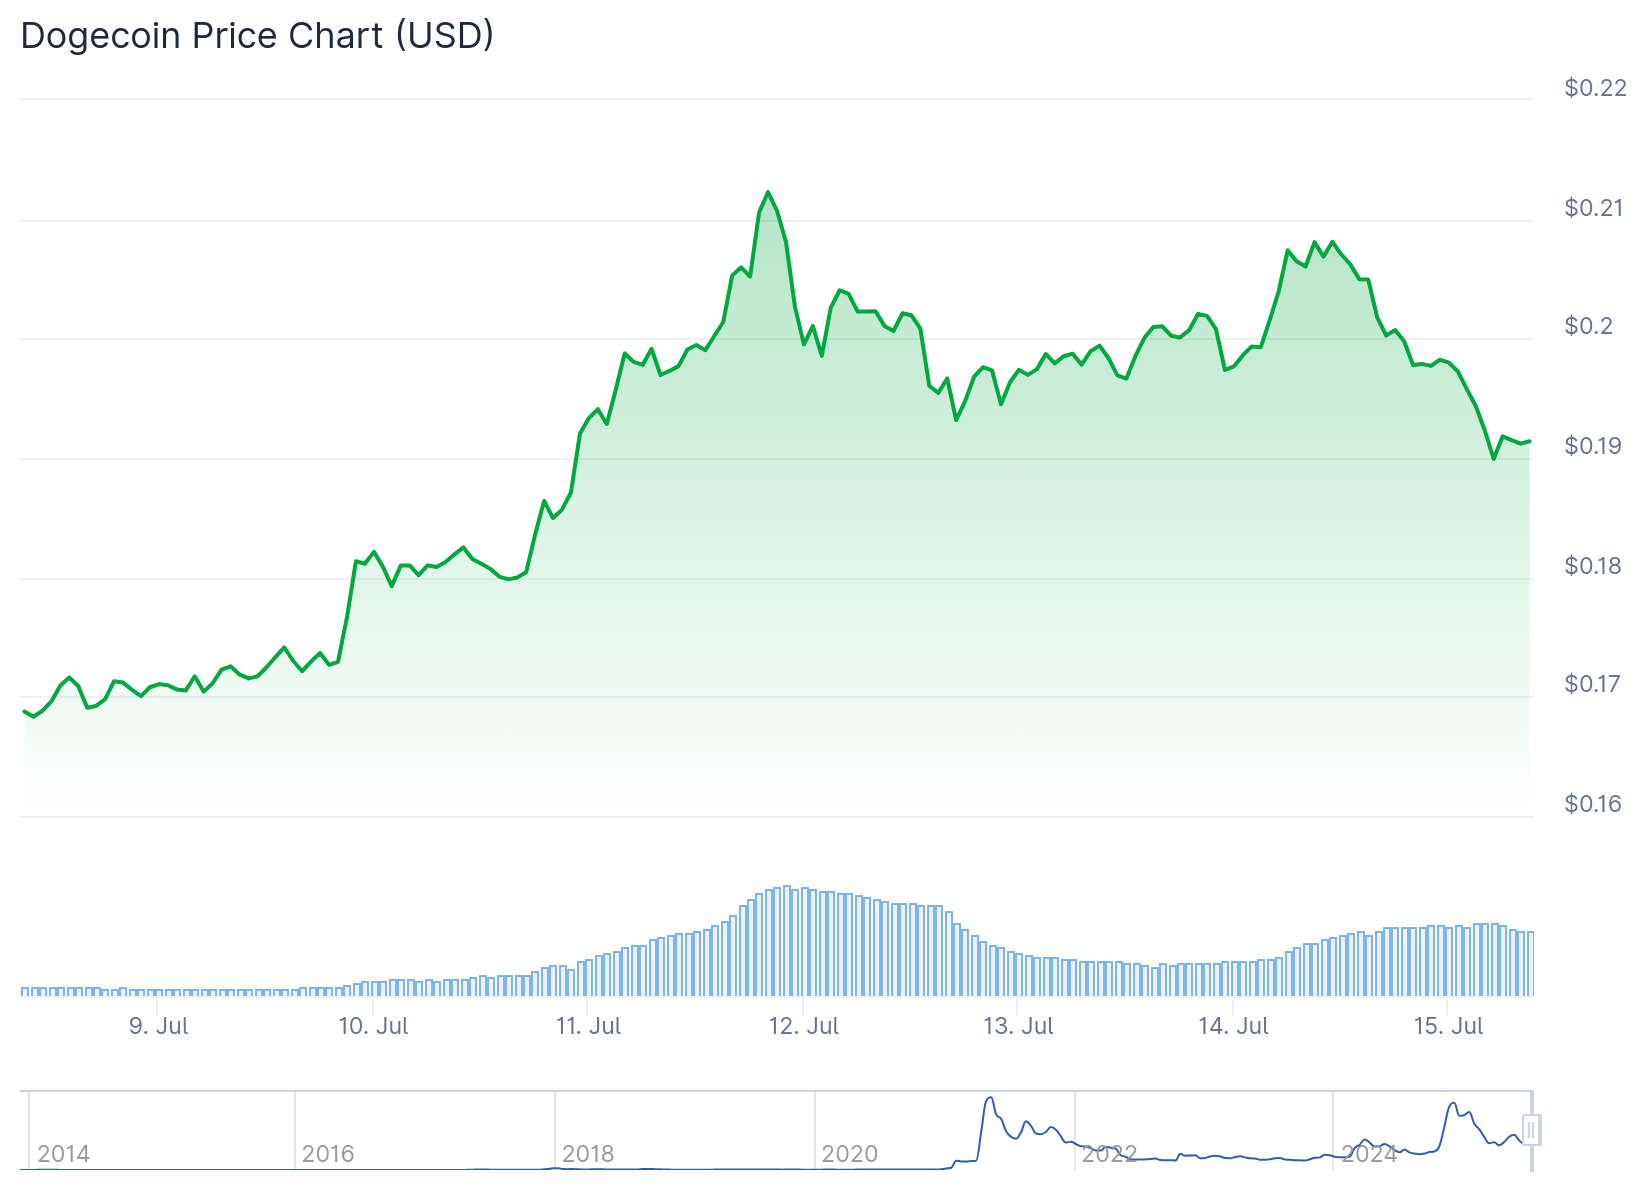
- Dogecoin gained 2.74% in 24 hours, reaching $0.2062 with trading volume surging 107.09% to $2.53 billion
- Weekly chart shows DOGE approaching key resistance at $0.21329, with breakout targets at $0.34177 and $0.48642
- A double bottom pattern suggests potential move toward $0.33 if price breaks above neckline resistance at $0.24
- Technical analysts identify similarities to October 2024 setup that preceded parabolic rally
- Fibonacci extension targets place DOGE as high as $1.168, representing potential 591% gain from current levels
Dogecoin has recorded gains during Monday’s Asian trading session, with the meme coin opening at $0.201 before climbing to current levels. The price action has caught the attention of technical analysts tracking potential breakout patterns.
According to CoinMarketCap data, Dogecoin is trading at $0.2062 after gaining 2.74% in the past 24 hours. The market cap rose to $30.96 billion, increasing 2.76% during the same period.
Trading volume surged 107.09% to $2.53 billion, indicating stronger market activity. Market data shows that Dogecoin started its 24-hour trend at $0.2008 and dipped below this level overnight before rebounding.
Price momentum shifted, pushing DOGE above $0.210 at its intraday peak. After a short retracement, it stabilized between $0.205 and $0.207.
Dogecoin gained 3.77% on the weekly chart, closing at $0.20603. The price is approaching a key resistance level near $0.21329, with analysts noting this area remains critical.
Key Resistance Levels
A weekly candle close above $0.21329 could confirm a breakout. A successful move beyond this range may lead to the next resistance zones around $0.34177 and $0.48642.
🐶 #Dogecoin Weekly TA$DOGE is approaching a key resistance at $0.21329.
For the bullish move to continue, we need a weekly candle close above this level.✅ Break and close above → next targets: $0.34 and $0.48
❌ Rejection here → possible pullback to support around… pic.twitter.com/1FbK8iNkIc— Bitcoinsensus (@Bitcoinsensus) July 14, 2025

Recent price action broke above the descending trendline, signaling a structural change in market direction. Dogecoin has also moved past earlier consolidation levels between $0.19716 and $0.20166.
The current price now trades near the mid-range of historical activity between $0.182 and $0.482. If the price fails to close above $0.21329, a potential retracement may follow toward the $0.18697 to $0.18296 support region.
Analysts have identified a double bottom pattern forming on the chart with support holding around $0.14. Dogecoin is now approaching neckline resistance at $0.24.
Many of you are asking about the future of #Dogecoin as #Bitcoin continues to hit new ATHs!
The first target is the neckline at $0,24. If we break through it, then we might shoot straight up to $0,33🎯
Posted in collab with the CoinEx Creator Program. @coinexcreators#CEX… pic.twitter.com/2j2C2VnsLl
— Hailey LUNC ✳️ (@TheMoonHailey) July 14, 2025
Technical Pattern Analysis
A breakout from this structure may trigger a measured move toward $0.33. This potential surge represents a 78.84% upside from the neckline zone.
The price has already gained momentum following the recent consolidation. With sustained pressure, $0.33 could serve as the next critical resistance.
Technical analyst Master Ananda notes that Dogecoin is flashing strong technical signals that closely resemble its last major breakout. After a long bear market following its 2021 all-time high, DOGE showed early signs of recovery in 2024.
Despite facing over eight weeks of bearish pressure between May and June, Dogecoin held a critical mid-term higher low. Now, with three consecutive green weekly candles and this week’s full-bodied breakout candle, analysts suggest a major move could be imminent.
If the pattern repeats, Fibonacci extension targets place DOGE as high as $1.168, a potential 591% gain from current prices. The current setup aligns with broader technical patterns, indicating the weekly close may determine the next leg in Dogecoin’s trend formation.


