


 Price: Faces $2.2 Billion Resistance Wall at $0.21 Level")
TLDR
- Dogecoin faces a $2.22 billion resistance wall at $0.21 where 10.5 billion DOGE coins were accumulated according to on-chain data
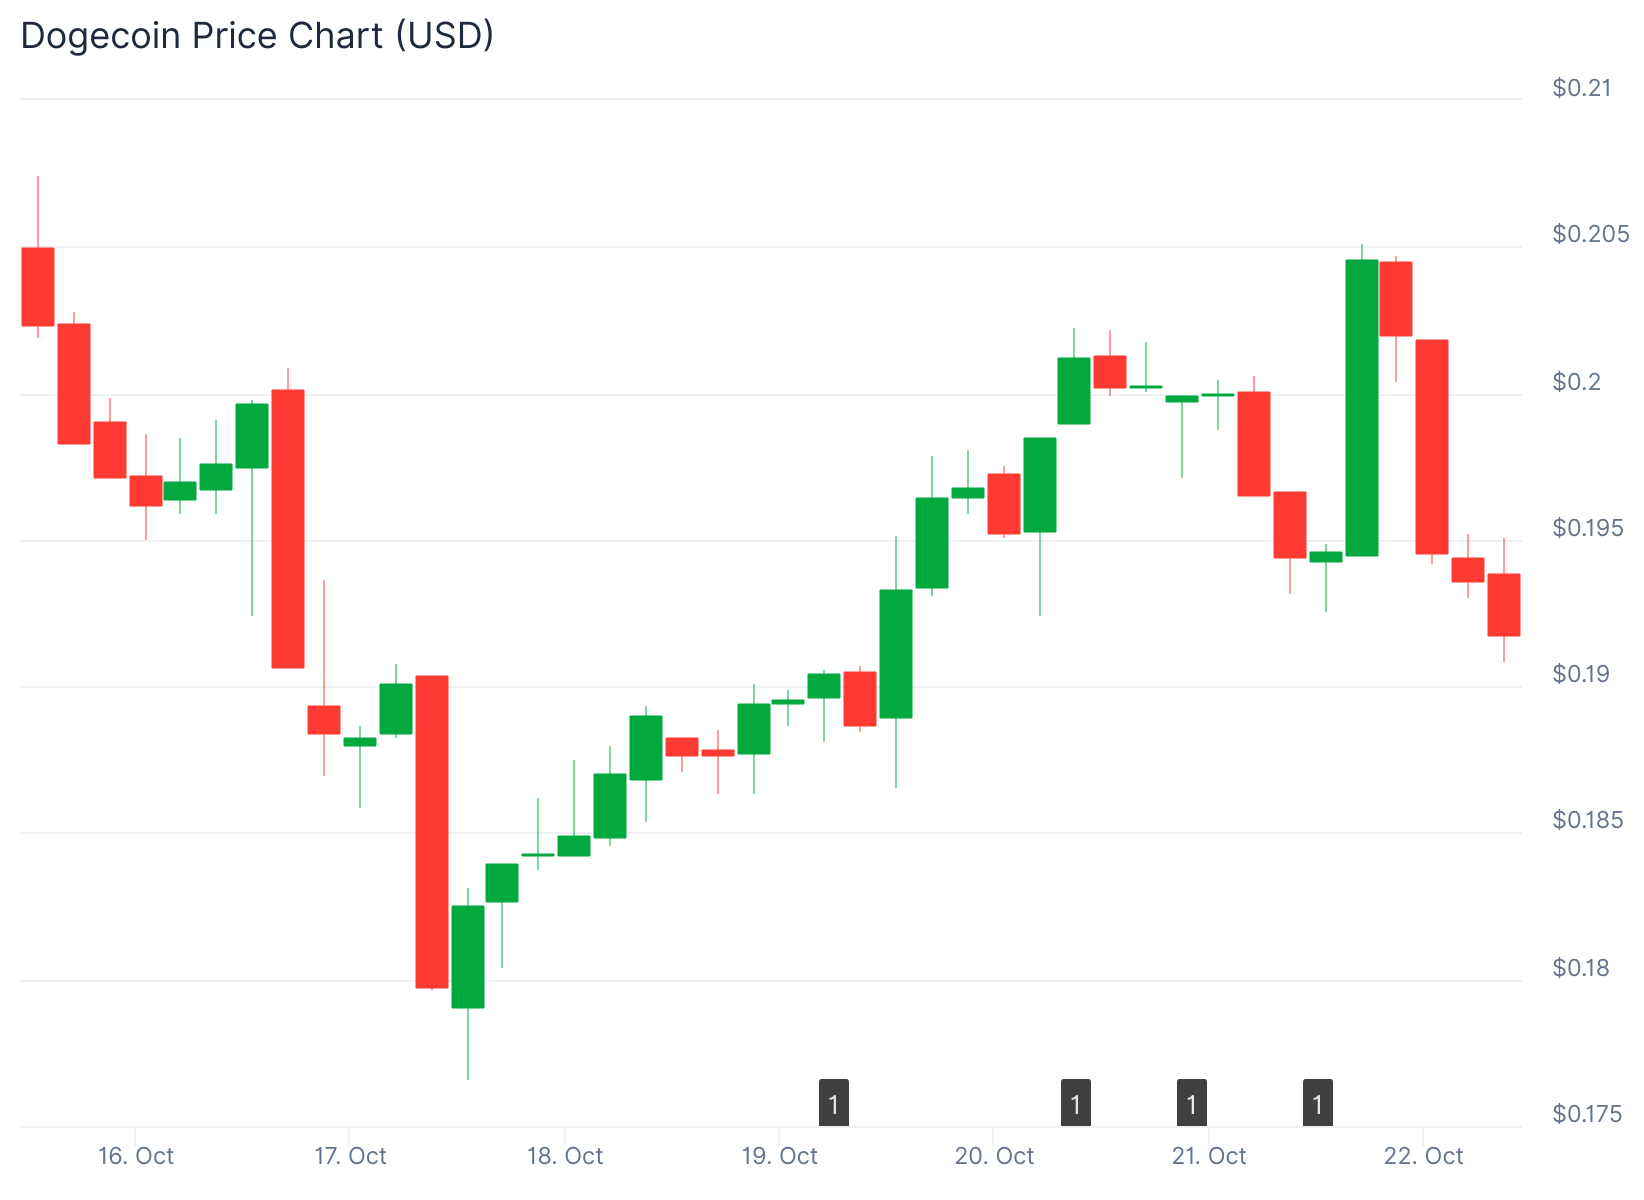
- The price currently trades at $0.19, above the 2-year moving average near $0.17, a level that historically preceded major rallies
- Analyst Ali Martinez identifies potential upside targets at $0.29, $0.45, and $0.86 if DOGE breaks through the $0.21 resistance
- Top 1% of addresses continue holding elevated supply percentages with no signs of distribution from large holders
- The $0.21 level represents both a Fibonacci retracement point and a dense cost-basis cluster, creating a critical inflection point
Dogecoin is currently facing a dense concentration of supply at the $0.21 price level. On-chain data from Glassnode shows a cost-basis distribution heatmap with heavy accumulation at this zone.
Market analyst Ali Martinez shared data revealing that 10.5 billion DOGE coins were accumulated at $0.21. This creates what he calls a “big resistance zone” that traders should monitor closely.
10.50 billion $DOGE were accumulated at $0.21. That’s a big resistance zone forming. Keep this level on your radar! pic.twitter.com/EufGapvuj0
— Ali (@ali_charts) October 20, 2025
The cost basis range sits between $0.21062334 and $0.21144839. The supply clustered at this level totals 10,575,420,761 DOGE coins. At the current $0.21 price point, this cohort represents roughly $2.22 billion in supply.
The price is currently trading at $0.195, just below this resistance zone. Martinez noted in a separate chart that Dogecoin “just bounced off the channel support and looks set to climb.”
His analysis identifies three upside targets if the resistance breaks. The first target sits at $0.29, followed by $0.45, and then $0.86. These levels align with classical retracement and extension points within an ascending channel structure.
Technical Structure Shows Historical Support Holding
The $0.21 area intersects with the 0.618 Fibonacci retracement level at approximately $0.21205. This overlap of technical and realized-price resistance explains the current price stall. Breaking through this level with strong volume would be needed for further upside.
Dogecoin $DOGE just bounced off the channel support and looks set to climb. Eyes on $0.29 first, then $0.45 and $0.86. https://t.co/UvRO5RvZ5g pic.twitter.com/U7M9jAbwQN
— Ali (@ali_charts) October 20, 2025
Dogecoin currently trades around $0.19, above its 2-year moving average near $0.17. Analyst Surf points out this setup mirrors patterns seen before DOGE’s largest rallies in the past.
In both 2017 and 2020, the coin consolidated above the 2-year moving average for months before surging. The 2021 rally that peaked above $0.70 followed the same pattern of holding above this moving average during accumulation phases.
The 2-year moving average acts as both support and confirmation that long-term buyers remain confident. Historical data shows every sustained period above this line preceded multi-month bullish phases.
Large Holders Maintain Position
On-chain data from analyst Cryptollica focuses on holder concentration. A chart showing “Percent of Supply Held by Top 1% Addresses” reveals that large holders have not begun distributing their coins.
The analyst noted that “the supply held 1% data downward trend has not yet been seen as the price moves toward a new all-time high.” The top 1% cohort maintains an elevated and recently rising share of supply as price recovered from cycle lows.
While concentration among large holders can amplify directional moves when balances rotate, the absence of a downtrend suggests no broad distribution has occurred. This indicates large addresses remain committed to their positions.
The bullish structure holds as long as price stays above the 2-year moving average zone between $0.17 and $0.18. Immediate resistance sits at $0.25 to $0.30 range.
A breakout above $0.25 could spark momentum toward the $0.30 to $0.35 range. This would shift the market from accumulation to active expansion phase.
The three data points paint a clear picture of the current battleground. The cost-basis heatmap identifies thick realized-supply exactly where price is struggling at $0.21. This implies latent sell pressure from holders looking to exit at break-even.
Martinez’s price structure marks the same zone as Fibonacci resistance within an established rising channel. Top-holder concentration has not rolled over, reducing evidence of heavy distribution into strength.
If bulls absorb the approximately $2.2 billion equivalent sitting at $0.21, Martinez’s stepped upside path provides clear overhead targets. The channel overlay tracks price respecting an ascending structure across multiple tests since 2023.
At press time, DOGE traded at $0.195 while maintaining position above the critical 2-year moving average support.

