


 Price: Triangle Pattern Sets Up Potential 50% Surge")
TLDR
- Dogecoin (DOGE) price has risen 16-20% over the past week but faces profit-taking pressure with 84% of addresses in profit
- Exchange inflows turned positive, suggesting some holders are preparing to sell their DOGE holdings
- A bullish ascending triangle pattern points to potential breakout targets at $0.28 and $0.36 if DOGE clears $0.25
- The critical support level at $0.22-$0.23 could determine whether DOGE continues rallying or experiences a pullback
- Key resistance sits at $0.29, which has rejected the price three times this year
Dogecoin has jumped around 20% over the past week after months of sideways movement. The meme coin’s recent surge comes after managing only 7.6% gains over the past three months.
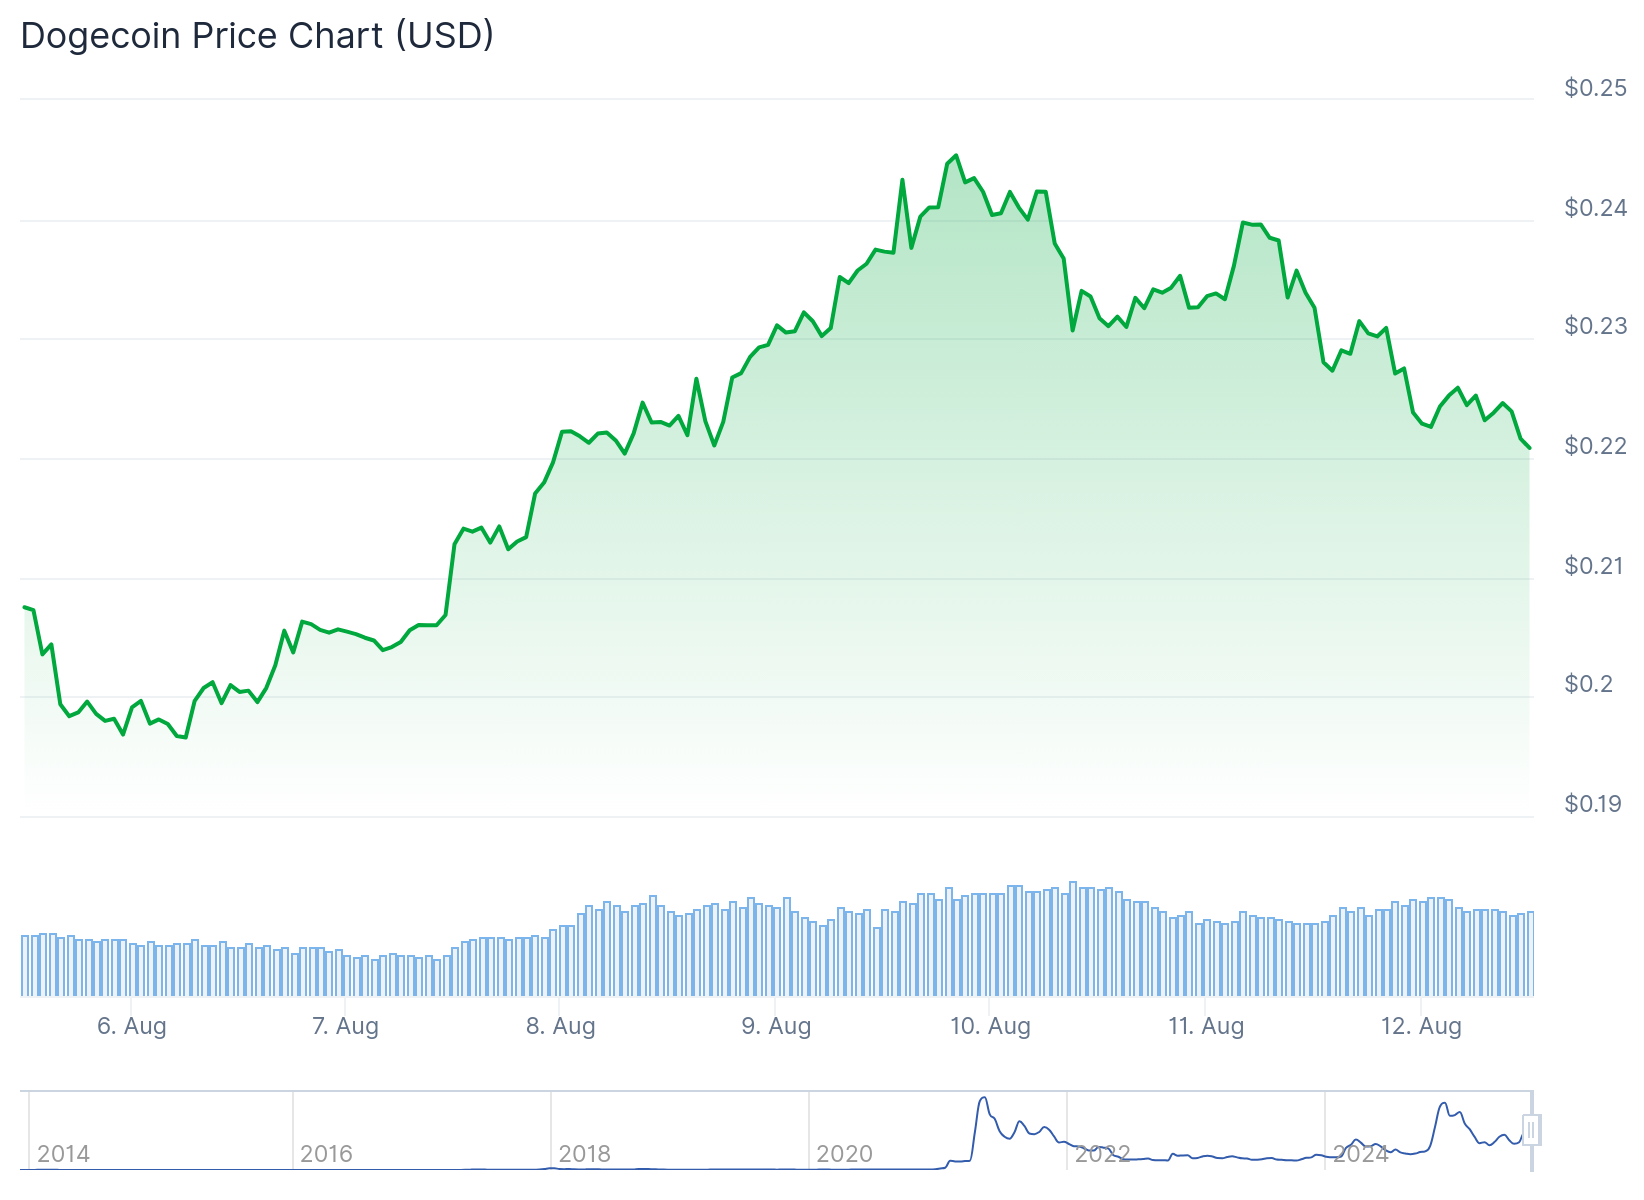
The price now hovers near $0.235, approaching key technical levels that could determine its next direction. Multiple indicators suggest both bullish potential and warning signs for the popular meme cryptocurrency.
Exchange data shows a shift in holder behavior. Spot netflow flipped from negative $52 million on August 10 to positive $2.7 million on August 11. This change indicates more DOGE is moving into exchanges.
The percentage of addresses holding DOGE at a profit recently touched 84%. This matches levels seen on July 27, before the price dropped from $0.24 to $0.19 within a week.
Technical Pattern Points to Breakout Potential
A bullish ascending triangle has formed on DOGE’s daily chart. This pattern shows higher lows while facing the same horizontal resistance level.
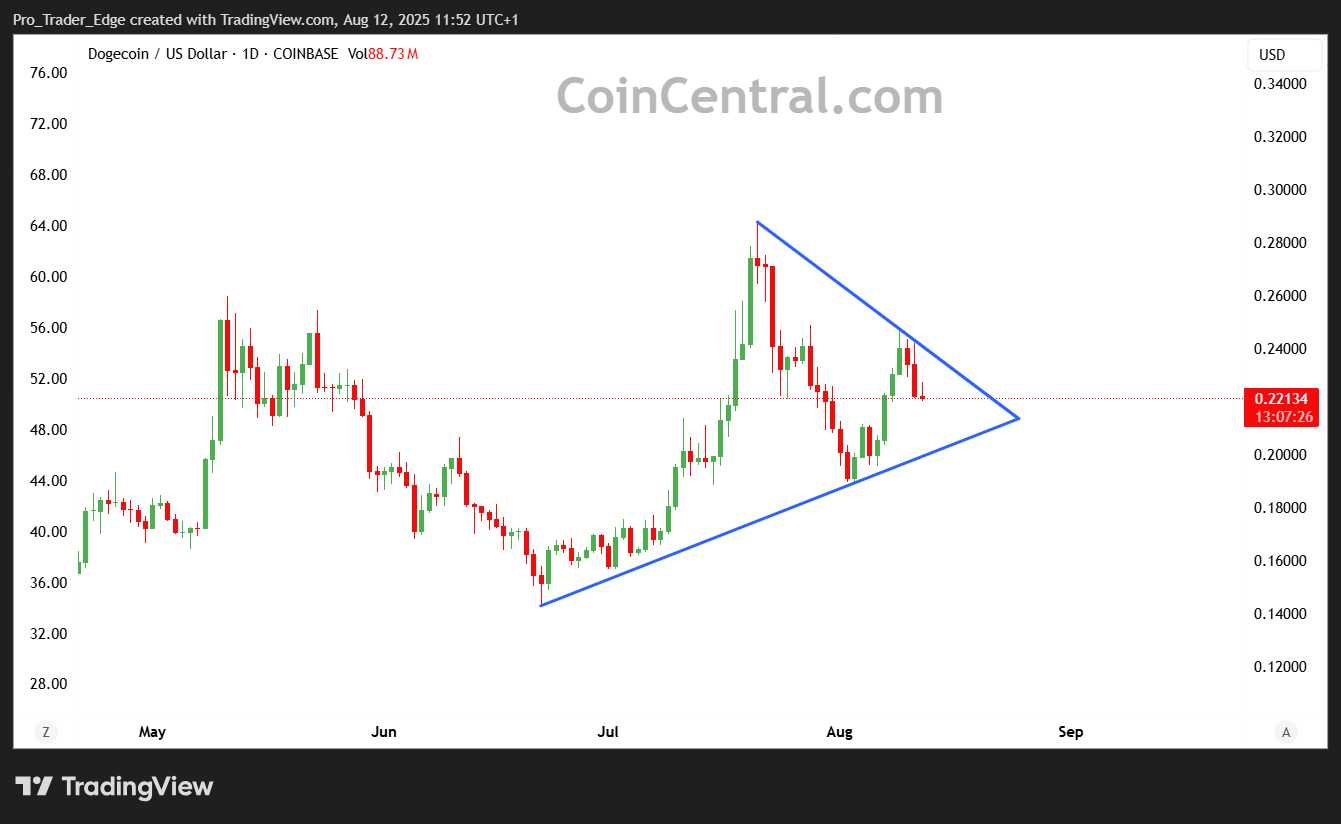
The upper boundary of the triangle sits at $0.25. A close above this level with strong volume could trigger the next leg up for DOGE price.
If the breakout succeeds, traders are watching targets at $0.28 and $0.36. The higher target would represent roughly a 50% rally from current levels.

Volume has started building as price approaches the breakout zone. Daily trading activity shows a steady climb, providing potential fuel for any upward move.
The MACD indicator has moved into positive territory for the first time in weeks. This shift suggests short-term momentum has turned in favor of buyers.
Key Levels Hold the Answer
The Spent Output Profit Ratio (SOPR) reached 1.045 on August 10. Readings above 1.0 indicate holders are selling at a profit.
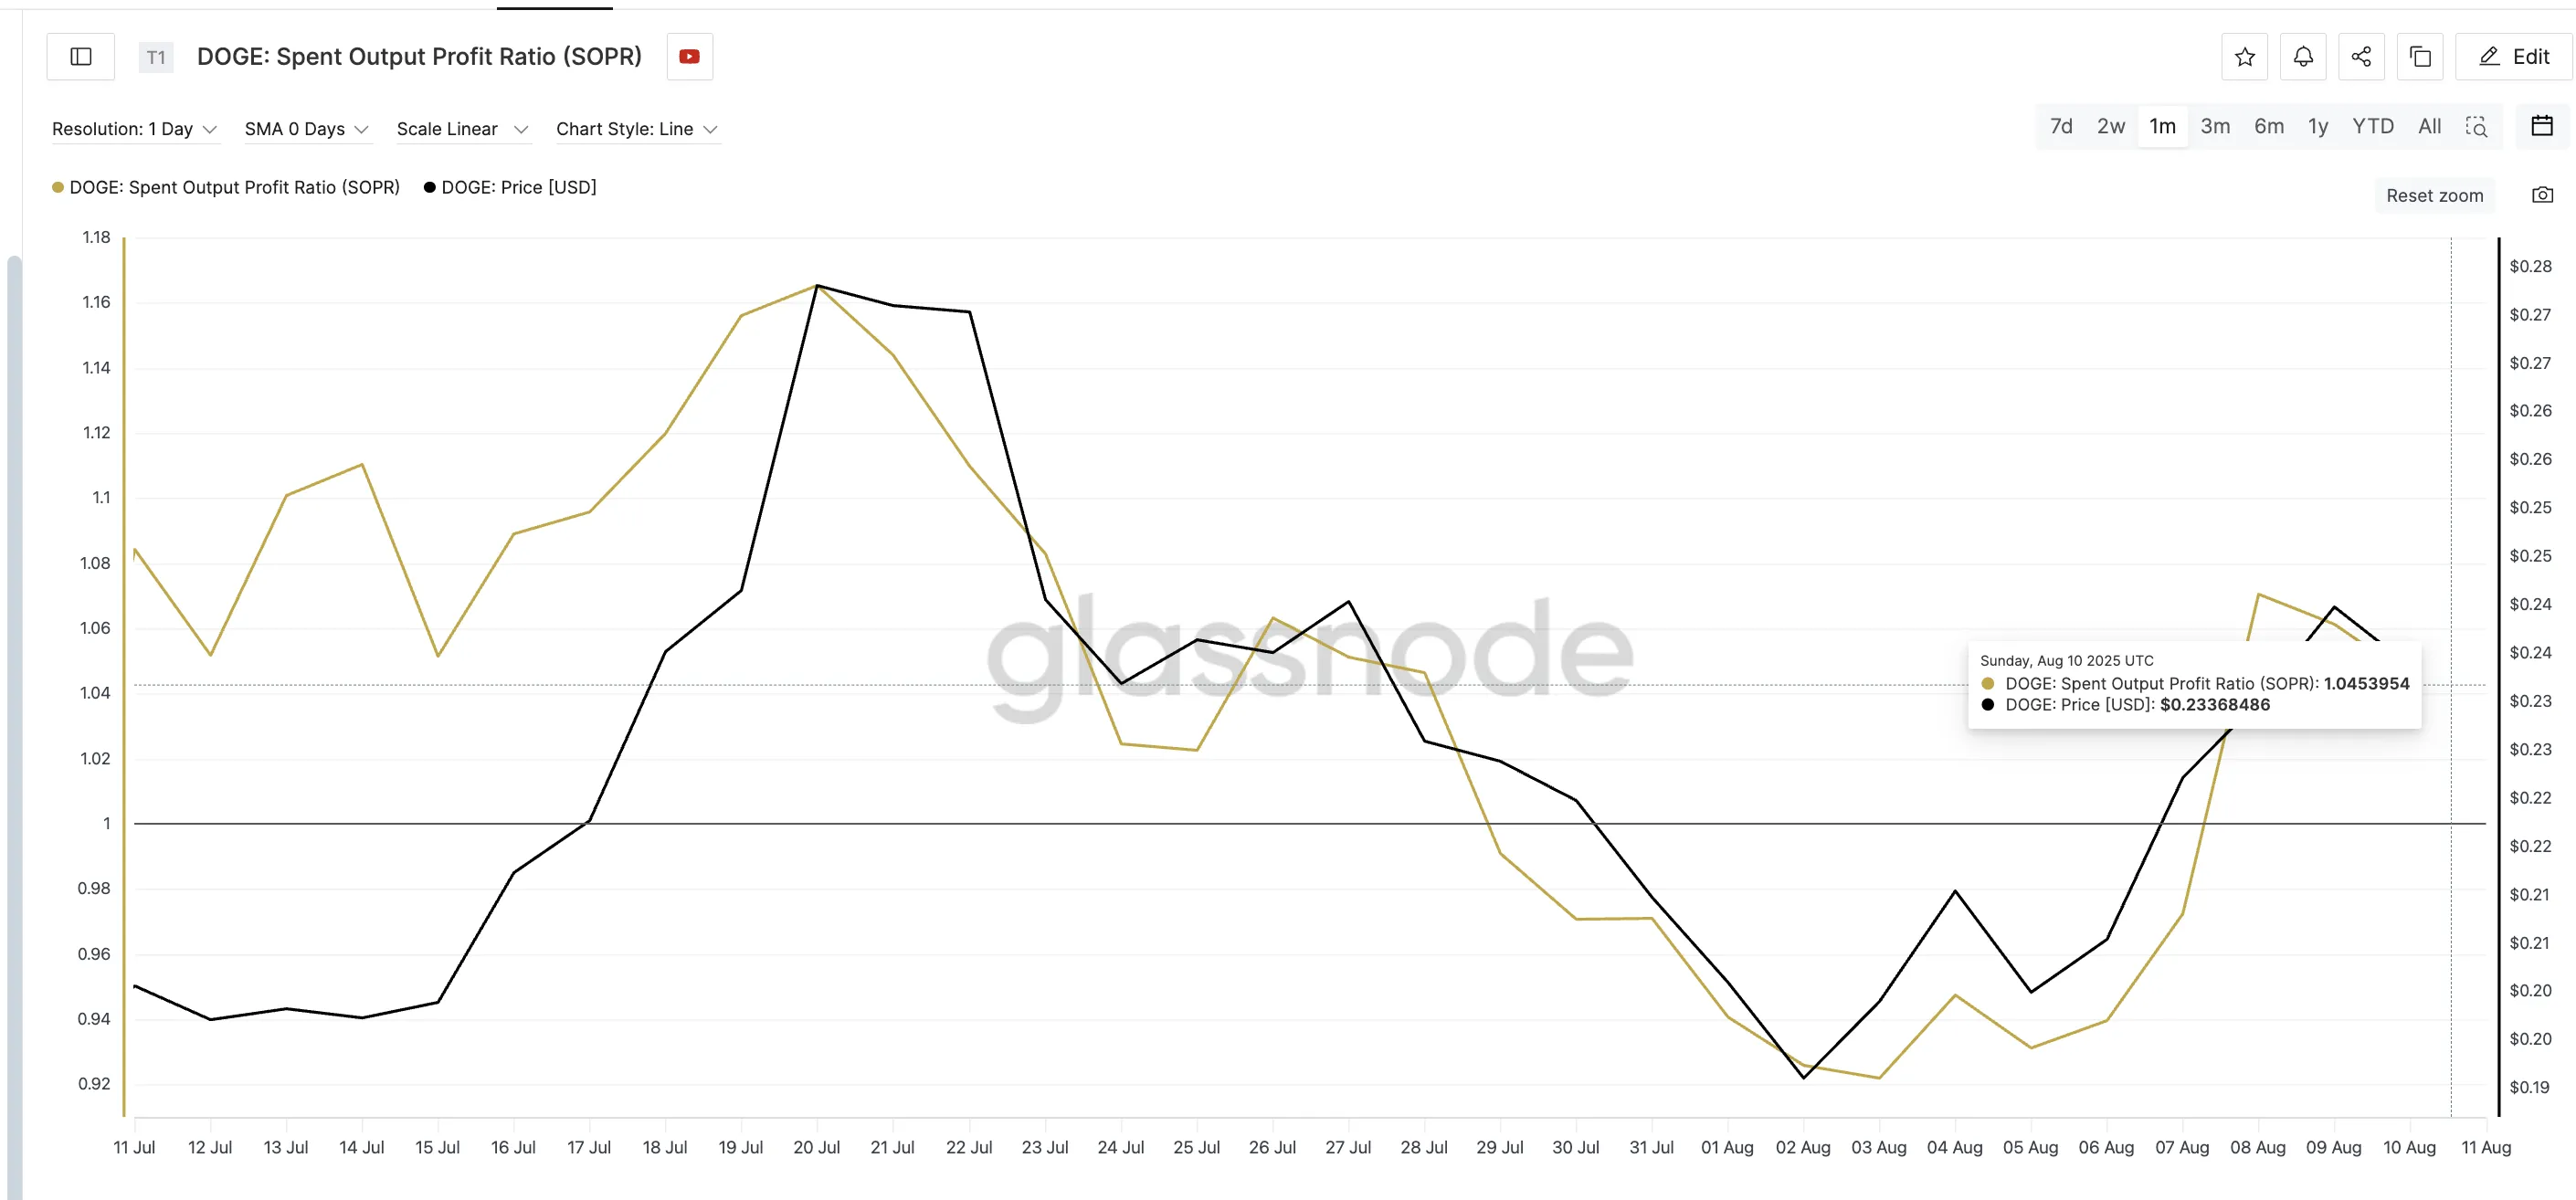
This level mirrors readings from late July that preceded quick pullbacks. The increasing SOPR aligns with signs that some holders may be preparing to take profits.
Support at $0.22-$0.23 has held strong in previous tests. This level now serves as a critical defense for bulls attempting to maintain upward momentum.
A break below $0.23 could delay the bullish breakout scenario. Such a move might push DOGE back toward the $0.20-$0.21 range.
The most challenging resistance sits at $0.29. This level has rejected DOGE price three times this year, making it a crucial hurdle for any sustained rally.
Clearing $0.29 convincingly would validate the bullish triangle breakout. Such a move could open the path toward the $0.36 target level.
Fractal analysis suggests DOGE is trading in a historically strong buy zone. Similar price levels have preceded major rallies in previous market cycles.
The current setup comes after months of consolidation. Long sideways periods often store energy that gets released in sharp moves once resistance breaks.
Trading volume patterns support the technical setup. Increased participation shows growing conviction among market participants as key levels approach.
The combination of bullish chart patterns and rising volume creates a compelling setup for traders. However, the profit-taking pressure and exchange inflows serve as warning signs.
DOGE price currently trades near $0.235, just under the falling trendline of a descending triangle on shorter timeframes. This creates conflicting signals between different chart patterns.
The Fibonacci levels act as support within the descending triangle formation. These levels align with the $0.23 support zone that traders are monitoring closely.


