






TLDR
- DOGE is trading around $0.089–$0.090, up roughly 10% from its September 2 low of $0.0817.
- A cup and handle pattern on the 4-hour chart points to a possible move toward $0.10.
- DOGE is trading above all four key daily moving averages, including the 200-day SMA at $0.08839.
- Spot buying is outpacing selling, but 4-hour capital flows remain slightly negative.
- The key resistance to watch is $0.092–$0.0926, where the largest liquidation cluster sits.
Dogecoin is holding near $0.090 on September 8, following a recovery of about 10% from its weekly low of $0.0817 set on September 2. The meme coin briefly touched $0.092 during the rebound before pulling back into a tight range between $0.089 and $0.091.
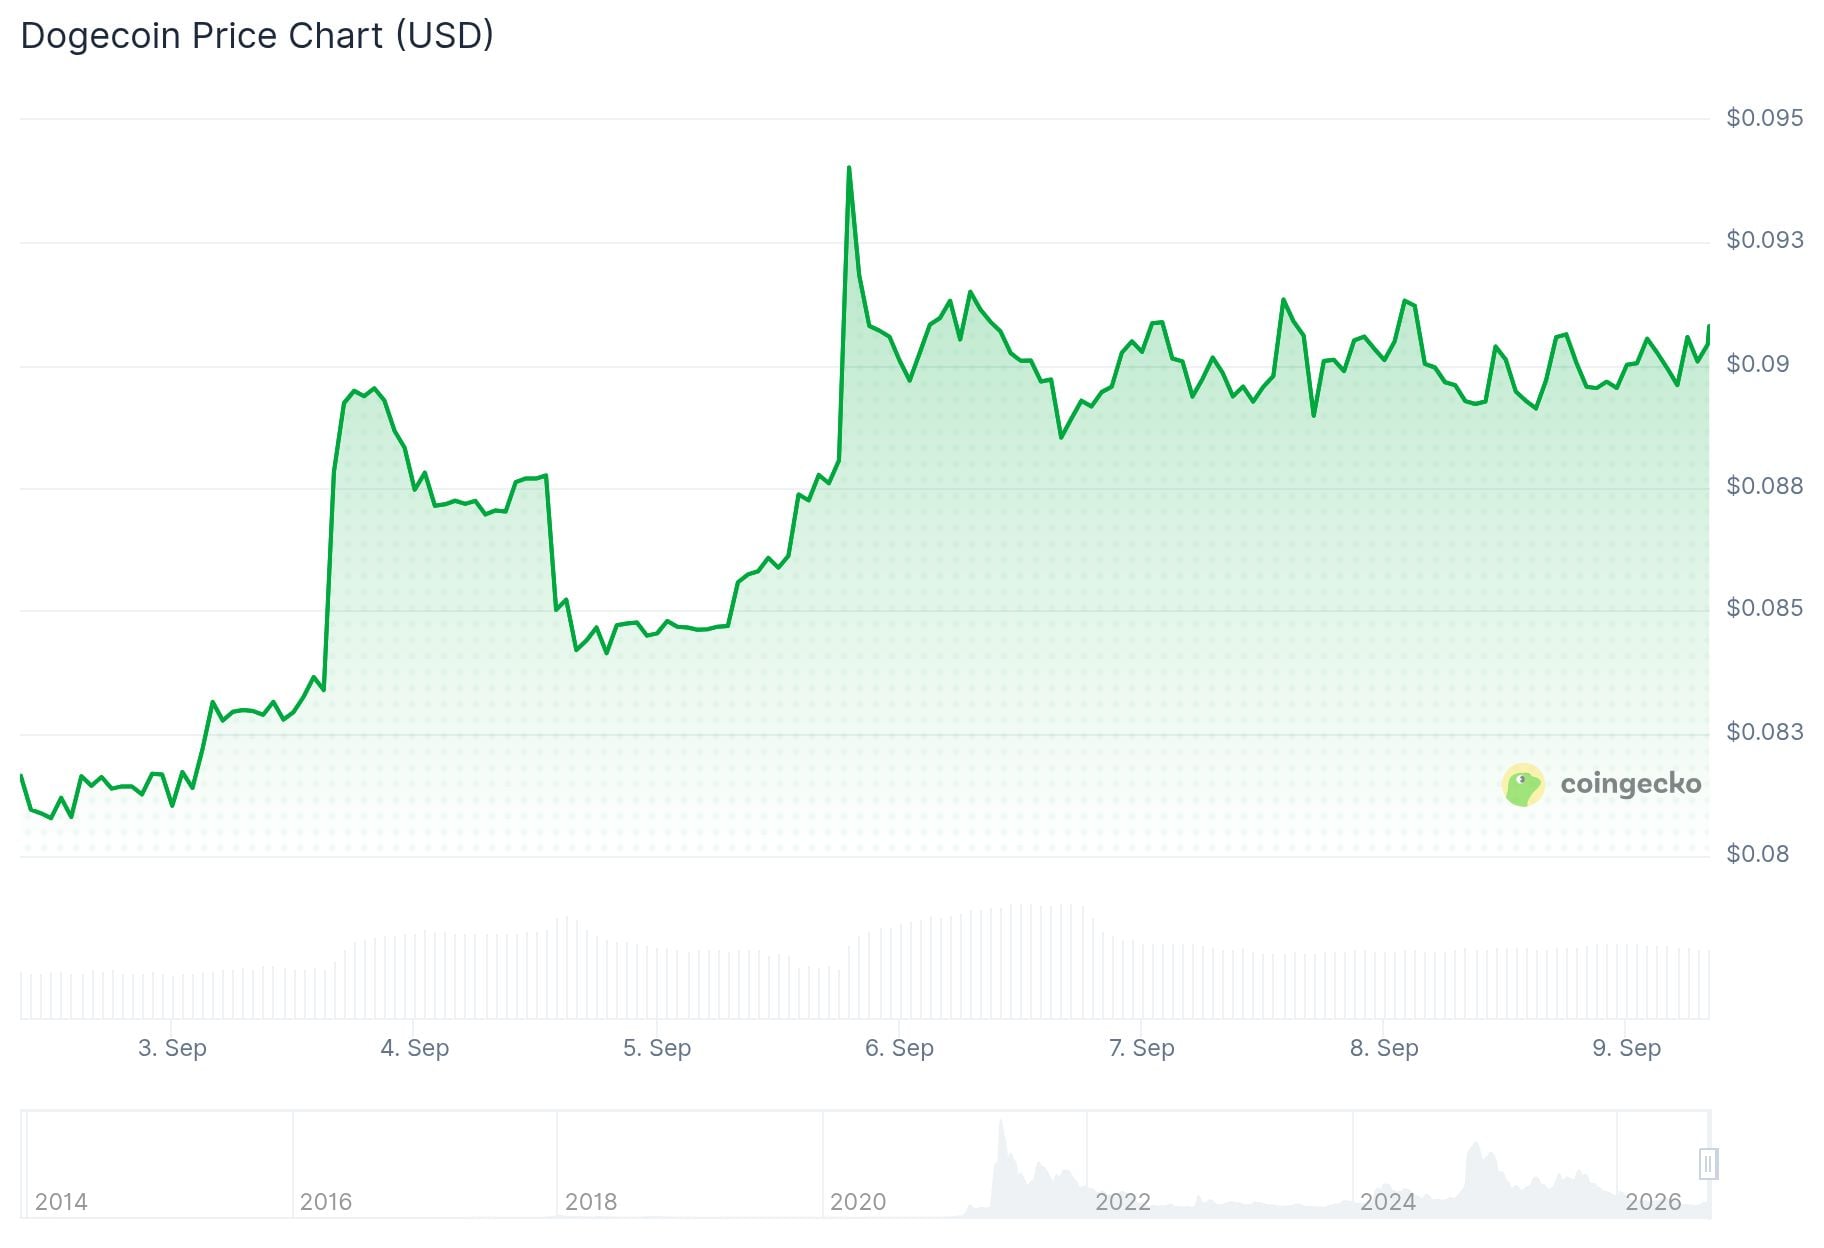
The recovery follows a broader bounce that started when DOGE found a base near $0.069 in August. A sharp rally that month pushed the token above $0.09, though sellers blocked any sustained move above $0.095.
Spot market data from CoinGlass shows $2.92 million more in buy-side volume than sell-side volume on September 8. Binance alone recorded $3.09 million more in buying flows than selling flows, suggesting buyers are still in control in the spot market.
The futures market also leans bullish. The weighted funding rate sits at a positive 0.0053%, meaning more traders are betting on price increases than decreases. However, open interest dropped 3.36% to $1.36 billion after $4.94 million in long positions were liquidated in 24 hours.
Technical Setup: Cup and Handle in Play
On the 4-hour chart, DOGE has formed a cup and handle pattern. The cup reflects a period of accumulation, and the handle shows consolidation under resistance as volatility contracts.
Analyst Trader Tardigrade highlighted this setup on social media, noting that a clean breakout above the handle trendline — confirmed by volume expansion and follow-through — could target the $0.10 level. He cautioned that without confirmation, DOGE likely stays range-bound and may retest support.
$DOGE/ 12-hour 🐕
❇️ A potential Cup and Handle structure has now formed.
The cup signals accumulation, and the tight handle shows controlled consolidation under resistance as volatility contracts near the pattern’s top.
A clean breakout above the handle could target the… pic.twitter.com/EliYzEmMK1
— Trader Tardigrade 🧬 (@TATrader_Alan) September 8, 2026

The RSI sits at 54, still favoring buyers, though the RSI line is below its signal line, pointing to weakening momentum. The Bollinger Bands are narrowing, suggesting consolidation is likely in the short term.
On the daily chart, DOGE trades above its 20-day SMA at $0.08713, 50-day, 100-day, and 200-day SMA at $0.08839. The MACD line sits at 0.00336, just above the signal line at 0.00321, keeping bullish momentum intact by a narrow margin.
Liquidation Clusters and Key Levels
The three-day liquidation heatmap from CoinGlass shows the densest cluster of leveraged positions between $0.092 and $0.0926. Additional liquidity sits near $0.094 and $0.0965.
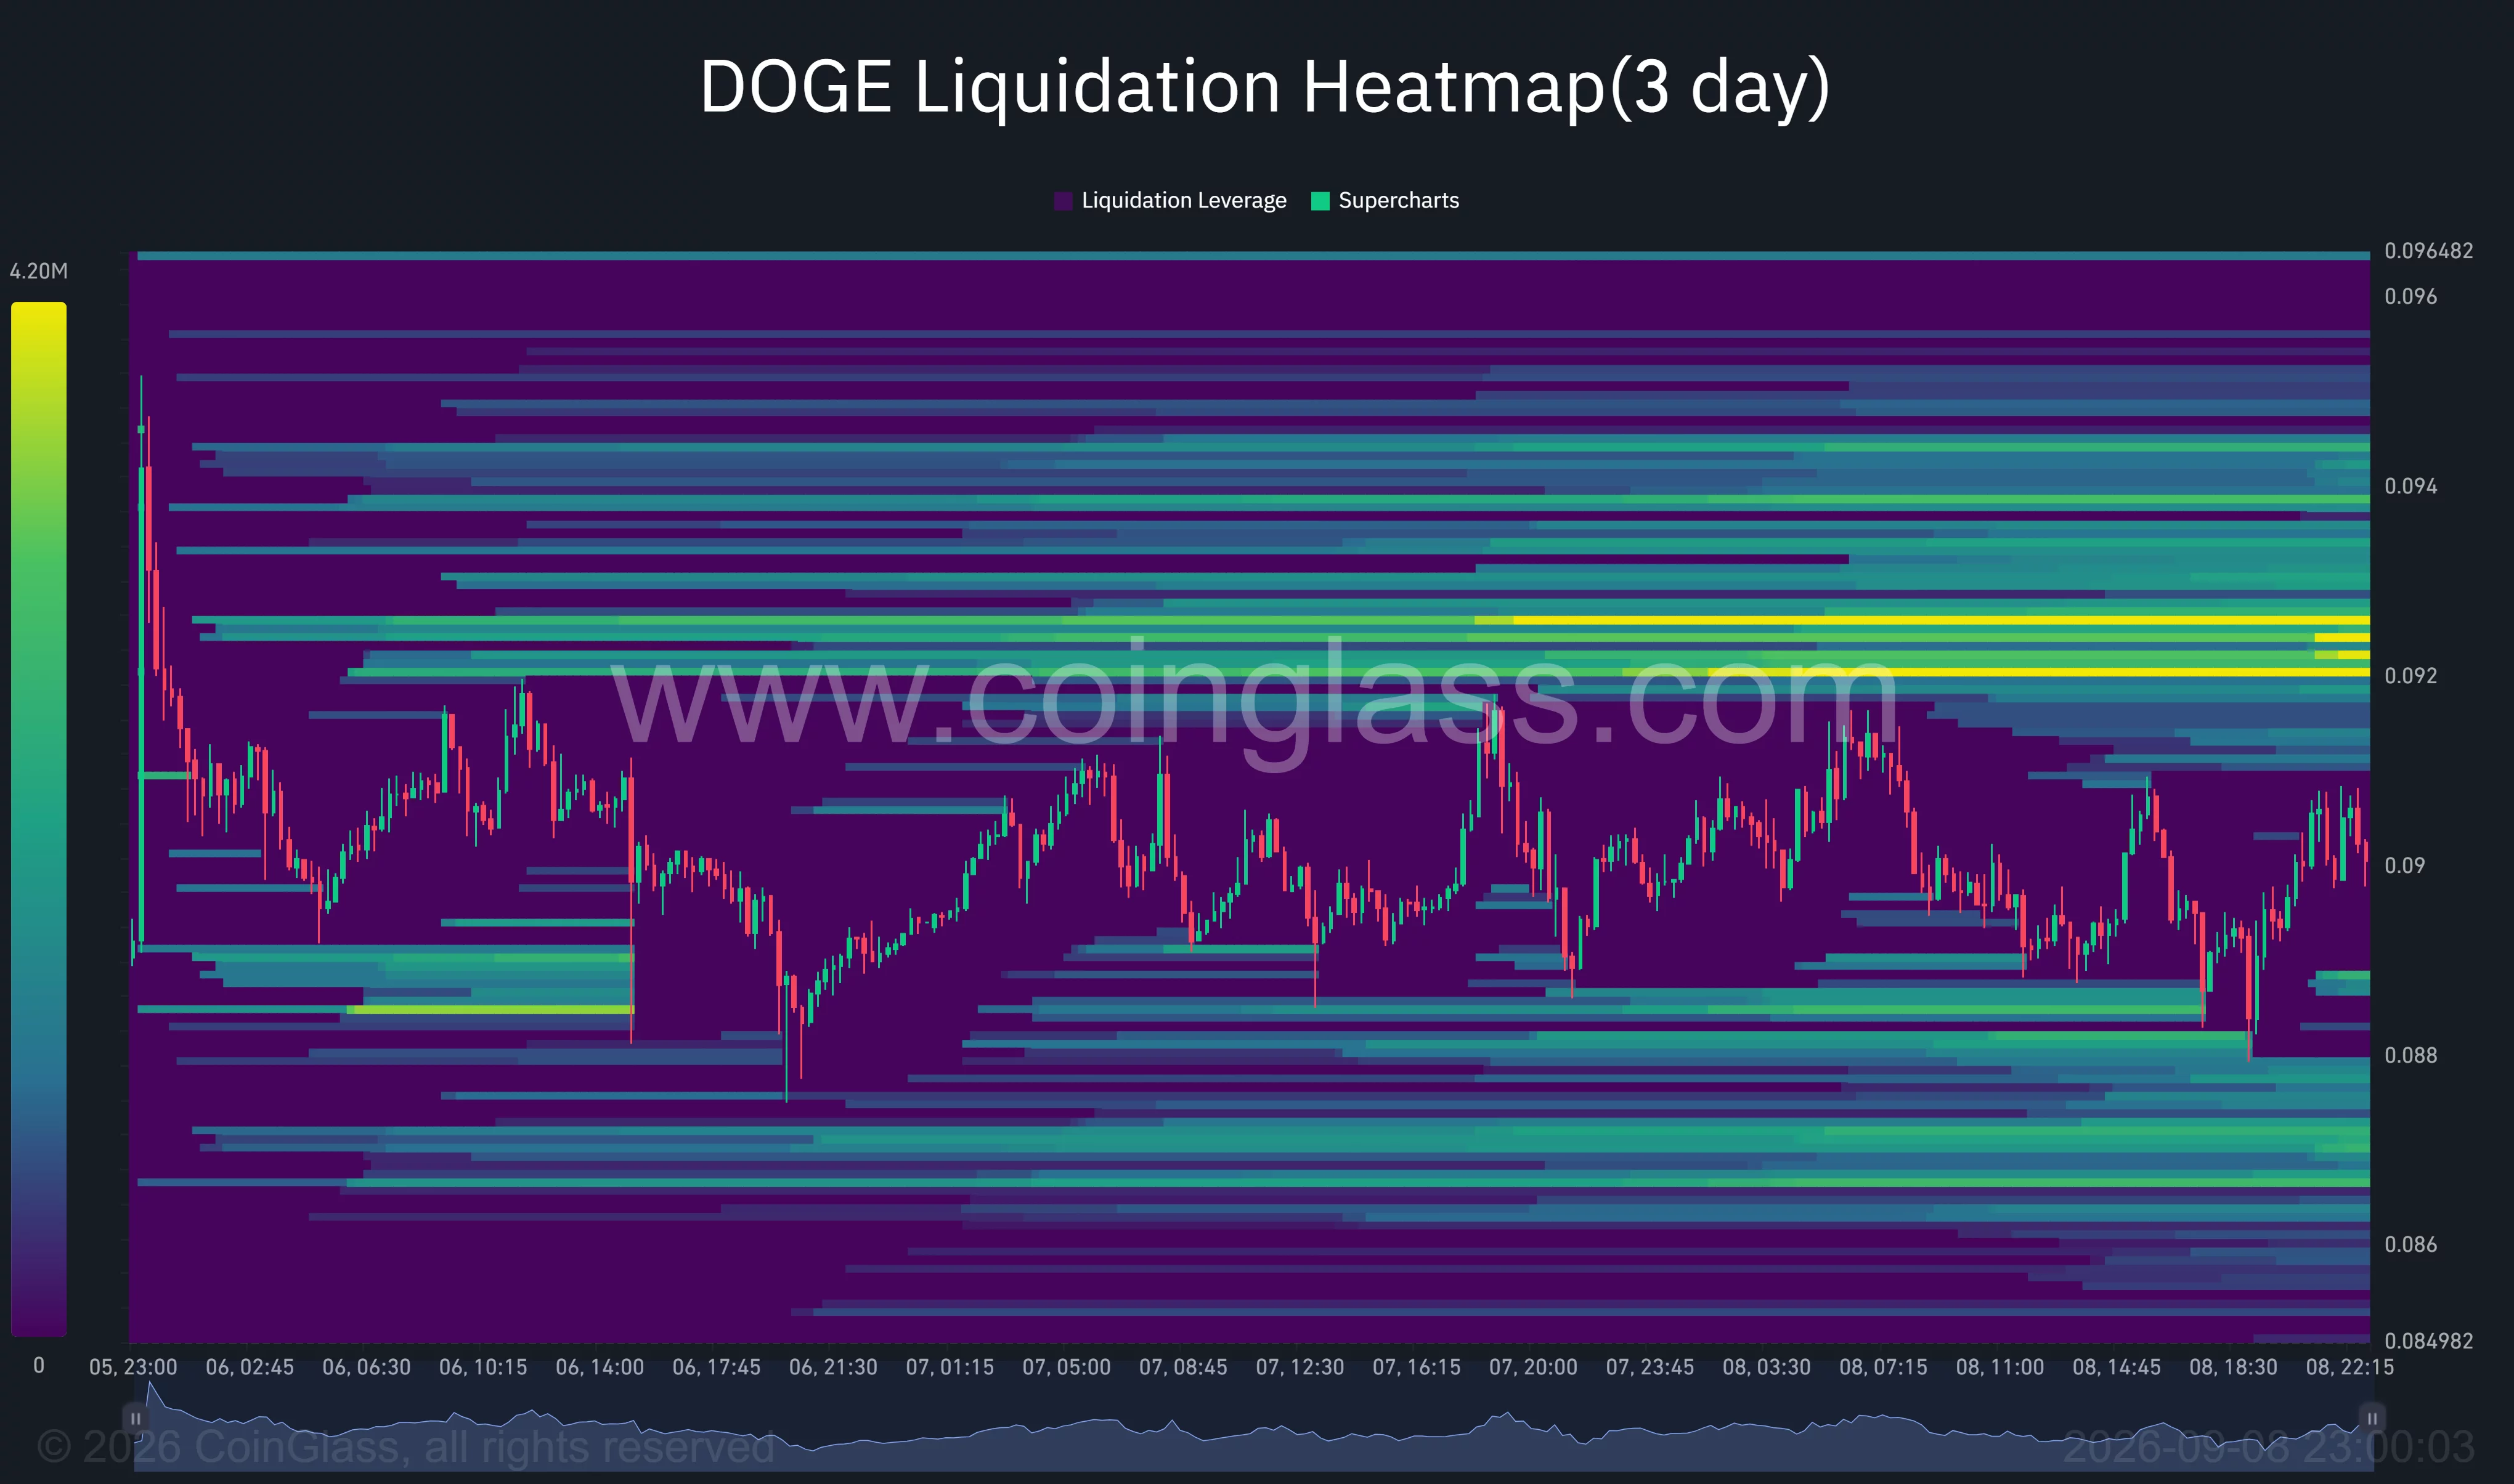
A move through $0.0926 would expose $0.094, where DOGE faced repeated rejections in late August. Clearing that could open the path to $0.0965 and $0.10.
Support levels sit at the 200-day SMA near $0.0884 and the 20-day SMA near $0.0871. The 4-hour Supertrend support is at $0.0847.
The 4-hour Chaikin Money Flow reading stands at minus 0.05, showing capital flow is still slightly negative. DOGE ETFs also recorded $343,580 in outflows during the week of August 31 to September 4, ending two straight weeks of inflows.


