


 Price: Analysts Target $5,000 As Exchange Holdings Drop to 9-Year Low")


TLDR
- Ethereum trades at $4,477, facing resistance at $4,500 while targeting $5,000
- Exchange balances hit a 9-year low of 14.88 million ETH, showing investor accumulation
- Sentiment index below 2.00 indicates fear among retail traders, historically a bullish signal
- Recent pullback below $4,650 creates bearish trend line with resistance at $4,520
- Support levels at $4,200 and $4,000 remain critical for maintaining upward momentum
Ethereum has gained momentum throughout August, trading near $4,477 at the time of writing. The second-largest cryptocurrency faces immediate resistance at $4,500 but shows underlying strength.
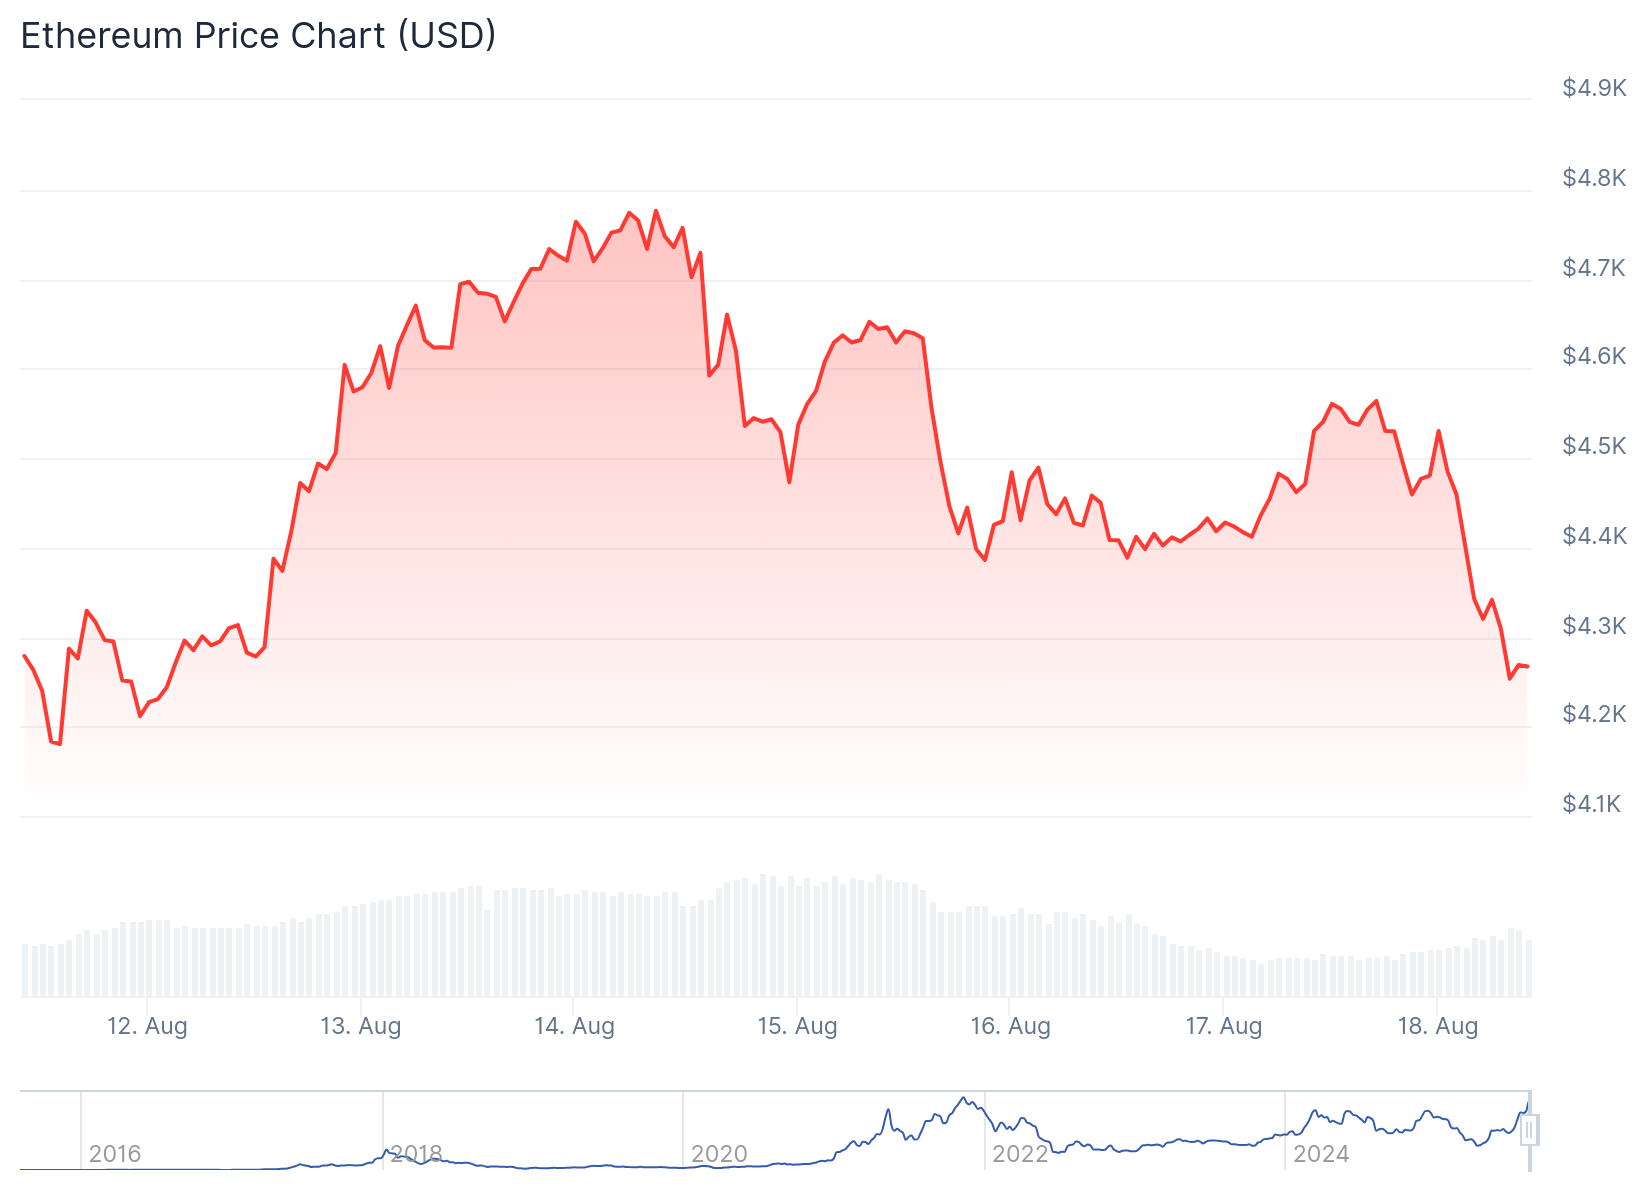
The current price action comes after a recent pullback from highs near $4,750. ETH dropped below the $4,650 support zone and now trades below the 100-hourly Simple Moving Average.
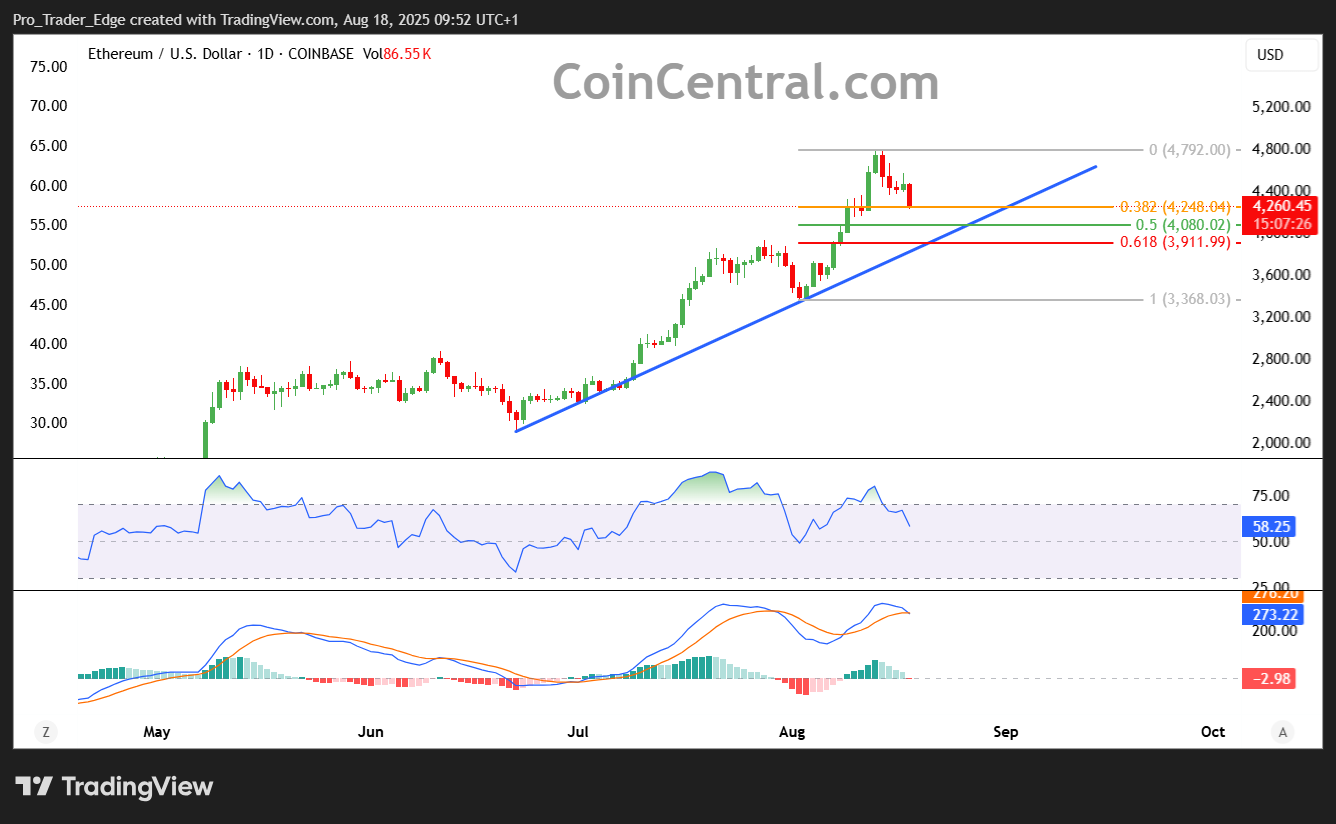
A bearish trend line has formed with resistance at $4,520 on the hourly chart. The price decline pushed ETH below the 61.8% Fibonacci retracement level from the recent swing low of $4,170 to the high of $4,782.
Investor Sentiment Shows Contrarian Signal
Ethereum’s sentiment index currently sits below 2.00, a level historically associated with elevated fear and uncertainty among retail investors. This low sentiment reading often acts as a contrarian indicator.
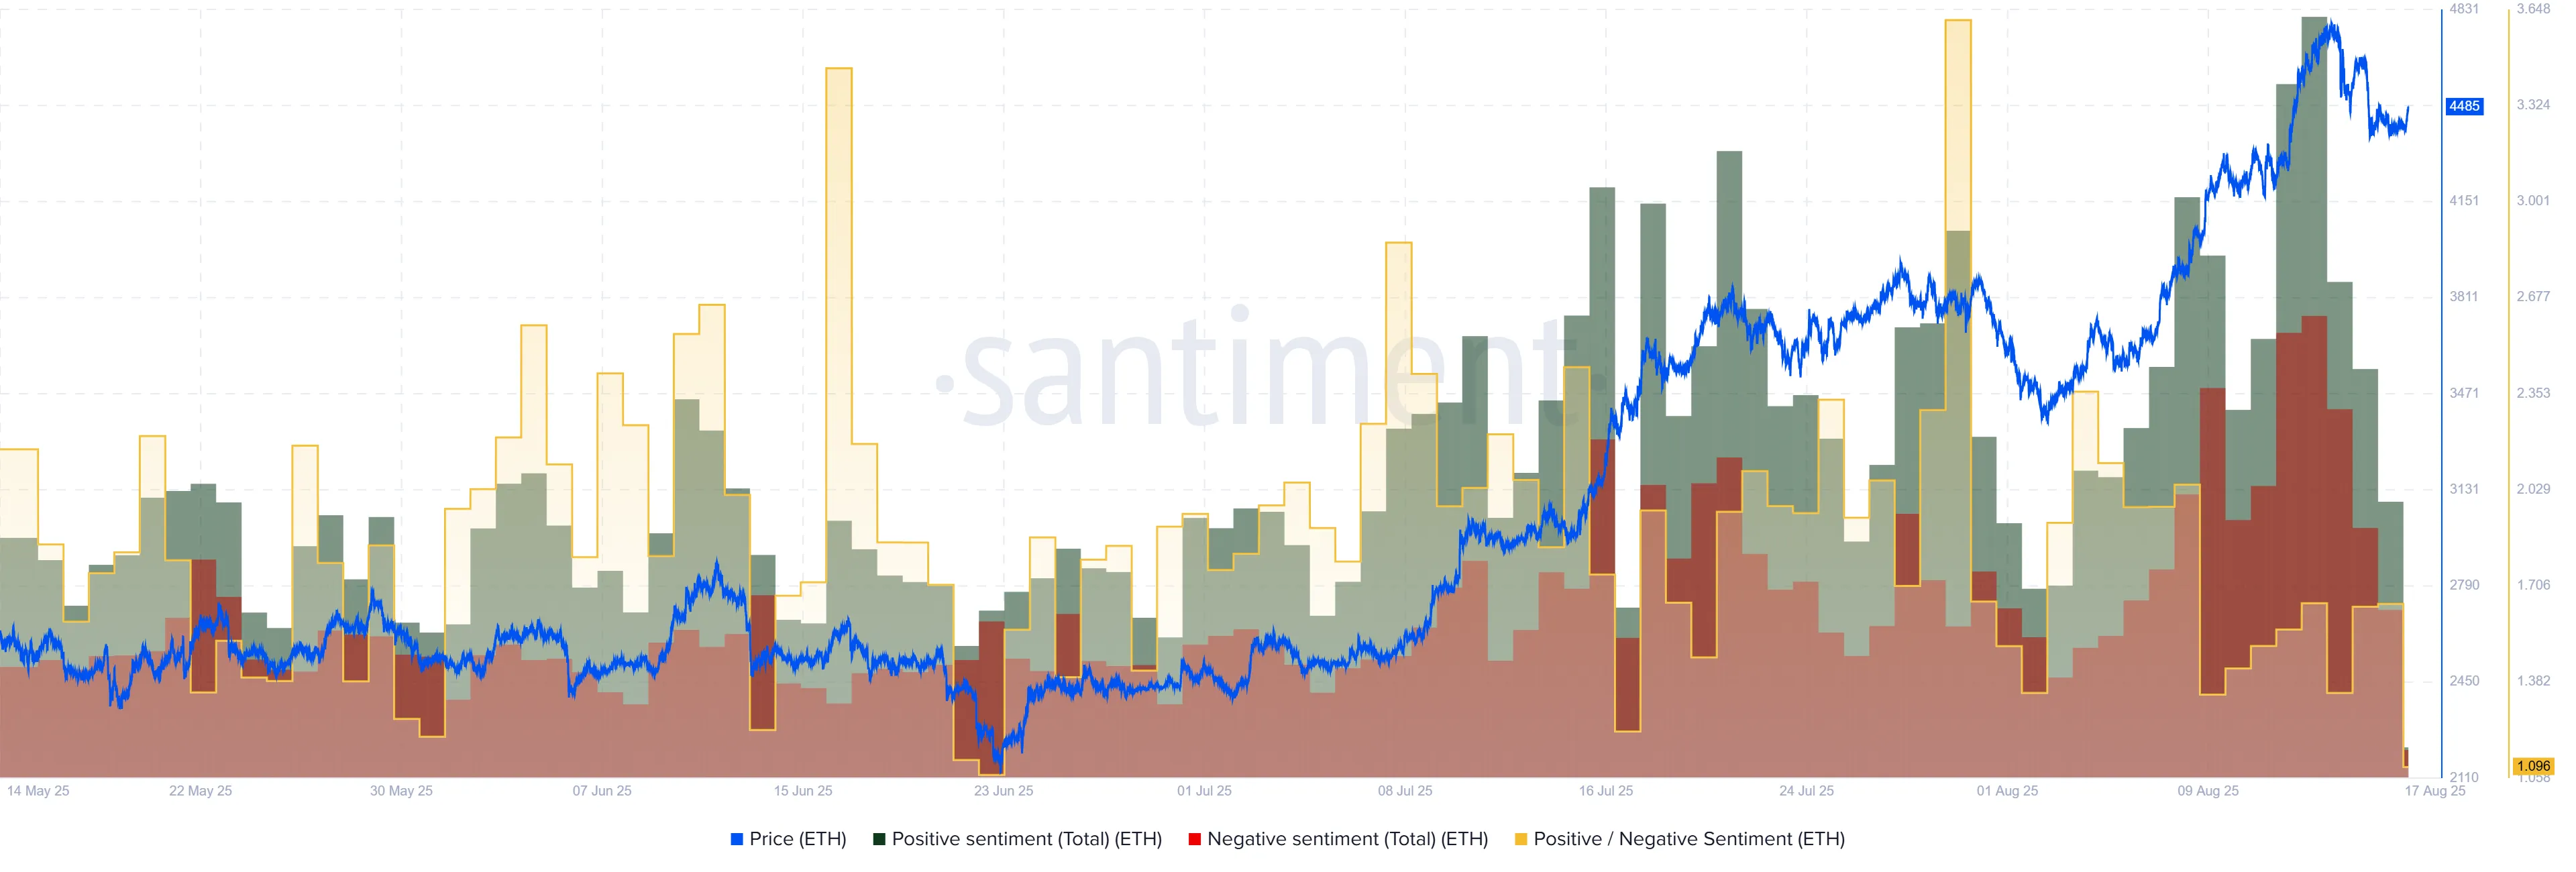
The market experienced extreme greed on June 16, 2025, and July 30, 2025. Both instances led to price corrections as excessive optimism invited selling pressure.
Today’s climate of disbelief comes while ETH continues setting higher prices. This pattern suggests sentiment-driven skepticism may fuel further rallies.
Exchange data supports the bullish thesis. Ethereum balances on exchanges dropped to a 9-year low of 14.88 million ETH.

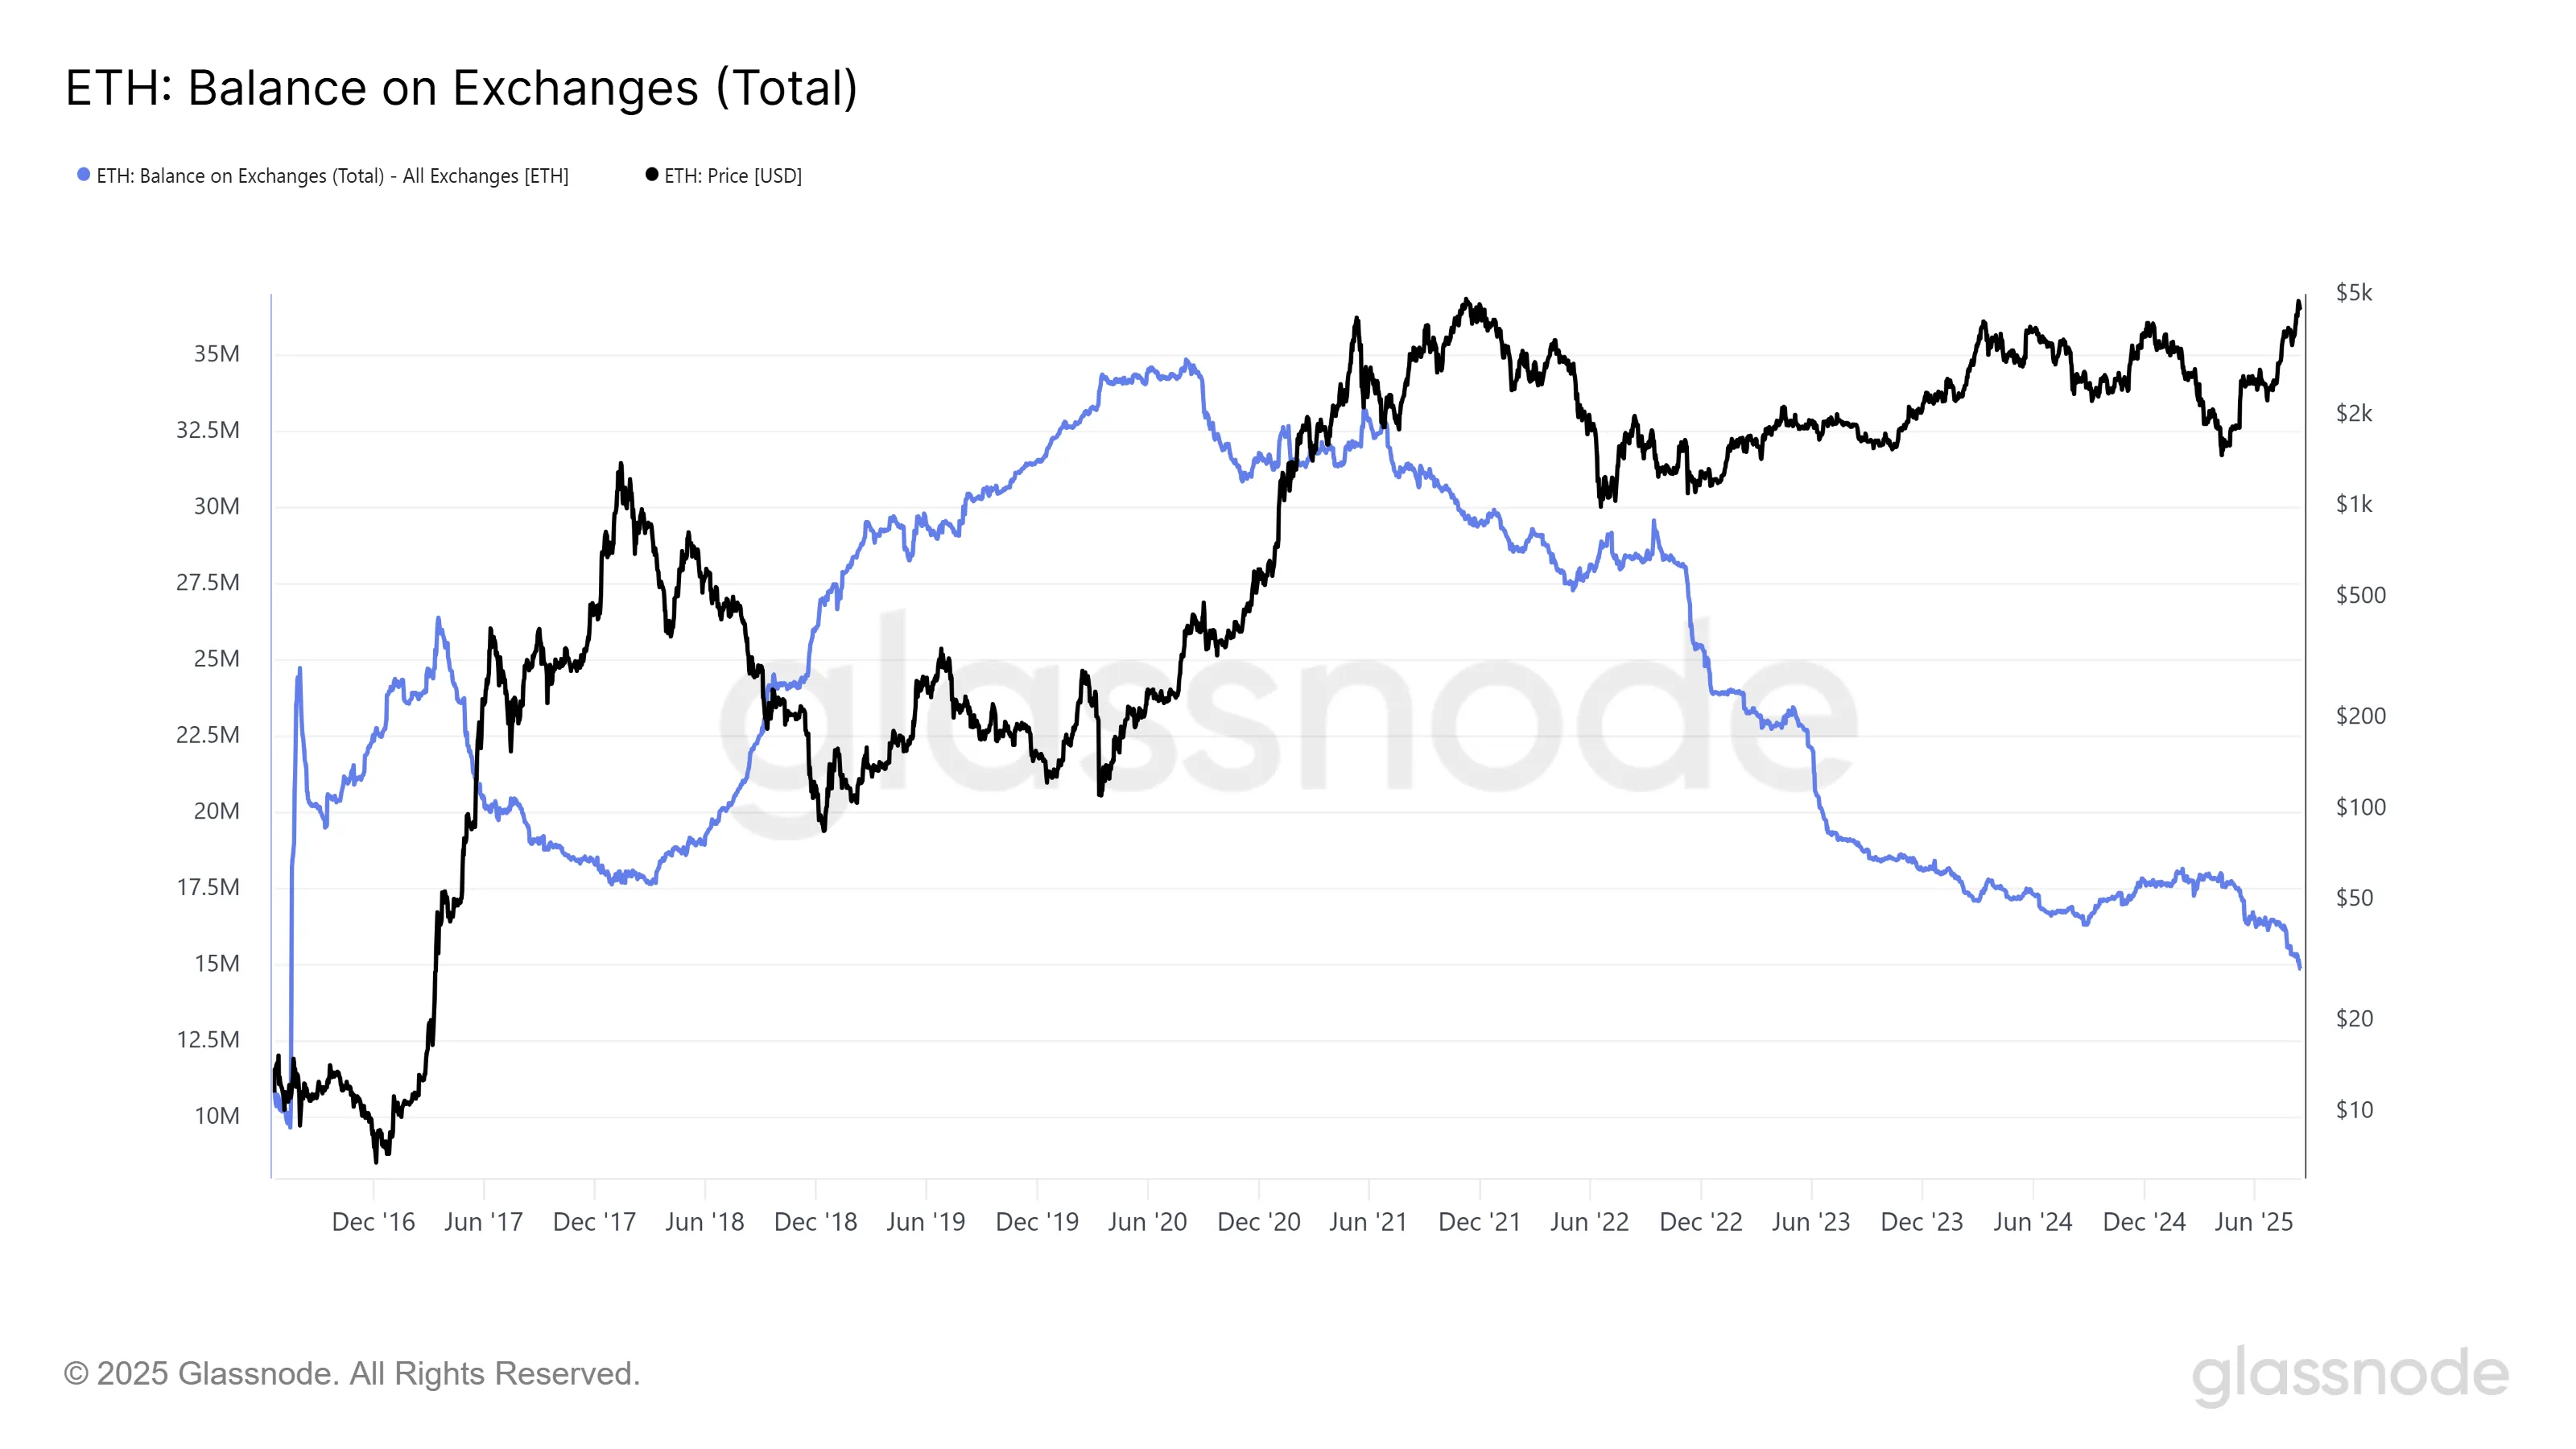
This decline signals investors are moving holdings into long-term storage. The trend indicates accumulation rather than preparation for selling.
Ethereum Price Prediction
About 470,000 ETH worth $211 million were purchased over the past week. While the pace remains modest, steady inflows show investor conviction.
Supply tightening combined with steady demand creates favorable conditions for price appreciation. The accumulation pattern reinforces confidence in Ethereum’s medium-term outlook.
Technical analysis shows ETH positioned just below key resistance at $4,500. A break above this level could accelerate the uptrend.
Reclaiming $4,500 as support would help push through the next resistance at $4,749. This move would pave the way for testing the $5,000 psychological level.
However, immediate resistance appears at $4,380 and $4,440 levels. The first major resistance sits at $4,500 based on current chart patterns.
Downside risks remain present if investor sentiment shifts suddenly. Profit-taking could push ETH toward $4,200 or the major support at $4,000.
A clear move below $4,200 support might extend losses toward $4,180. Further declines could test the $4,050 and $4,000 support levels.
The MACD indicator shows gaining momentum in the bearish zone. The RSI has dropped below the 50 level, indicating weakening momentum.
Market participants are watching the $4,500 level closely. A decisive break could determine whether Ethereum continues toward $5,000 or faces further consolidation.
The combination of low exchange balances, contrarian sentiment signals, and technical positioning creates a mixed but potentially bullish environment for ETH in the near term.


