


 Price: Bitmine’s Tom Lee Predicts Bottom This Week After 20% Decline")


TLDR
- Ether dropped nearly 20% in November, falling from $3,900 to retest $3,000 for the first time since July 15.
- The Mayer Multiple indicator fell below 1, entering a historical “buy zone” that has previously preceded strong multi-month recoveries.
- Liquidity data shows potential for further drops to $2,904-$2,916 or $2,760-$2,772 before forming a stable base.
- Tom Lee predicts ETH will bottom this week and could eventually reach $12,000 to $62,000 depending on market conditions.
- Technical analysis shows a falling wedge pattern forming, which typically signals a potential bullish breakout toward $4,000.
Ethereum’s price has fallen nearly 20% throughout November. The second-largest cryptocurrency dropped from $3,900 to retest the $3,000 level on November 17.
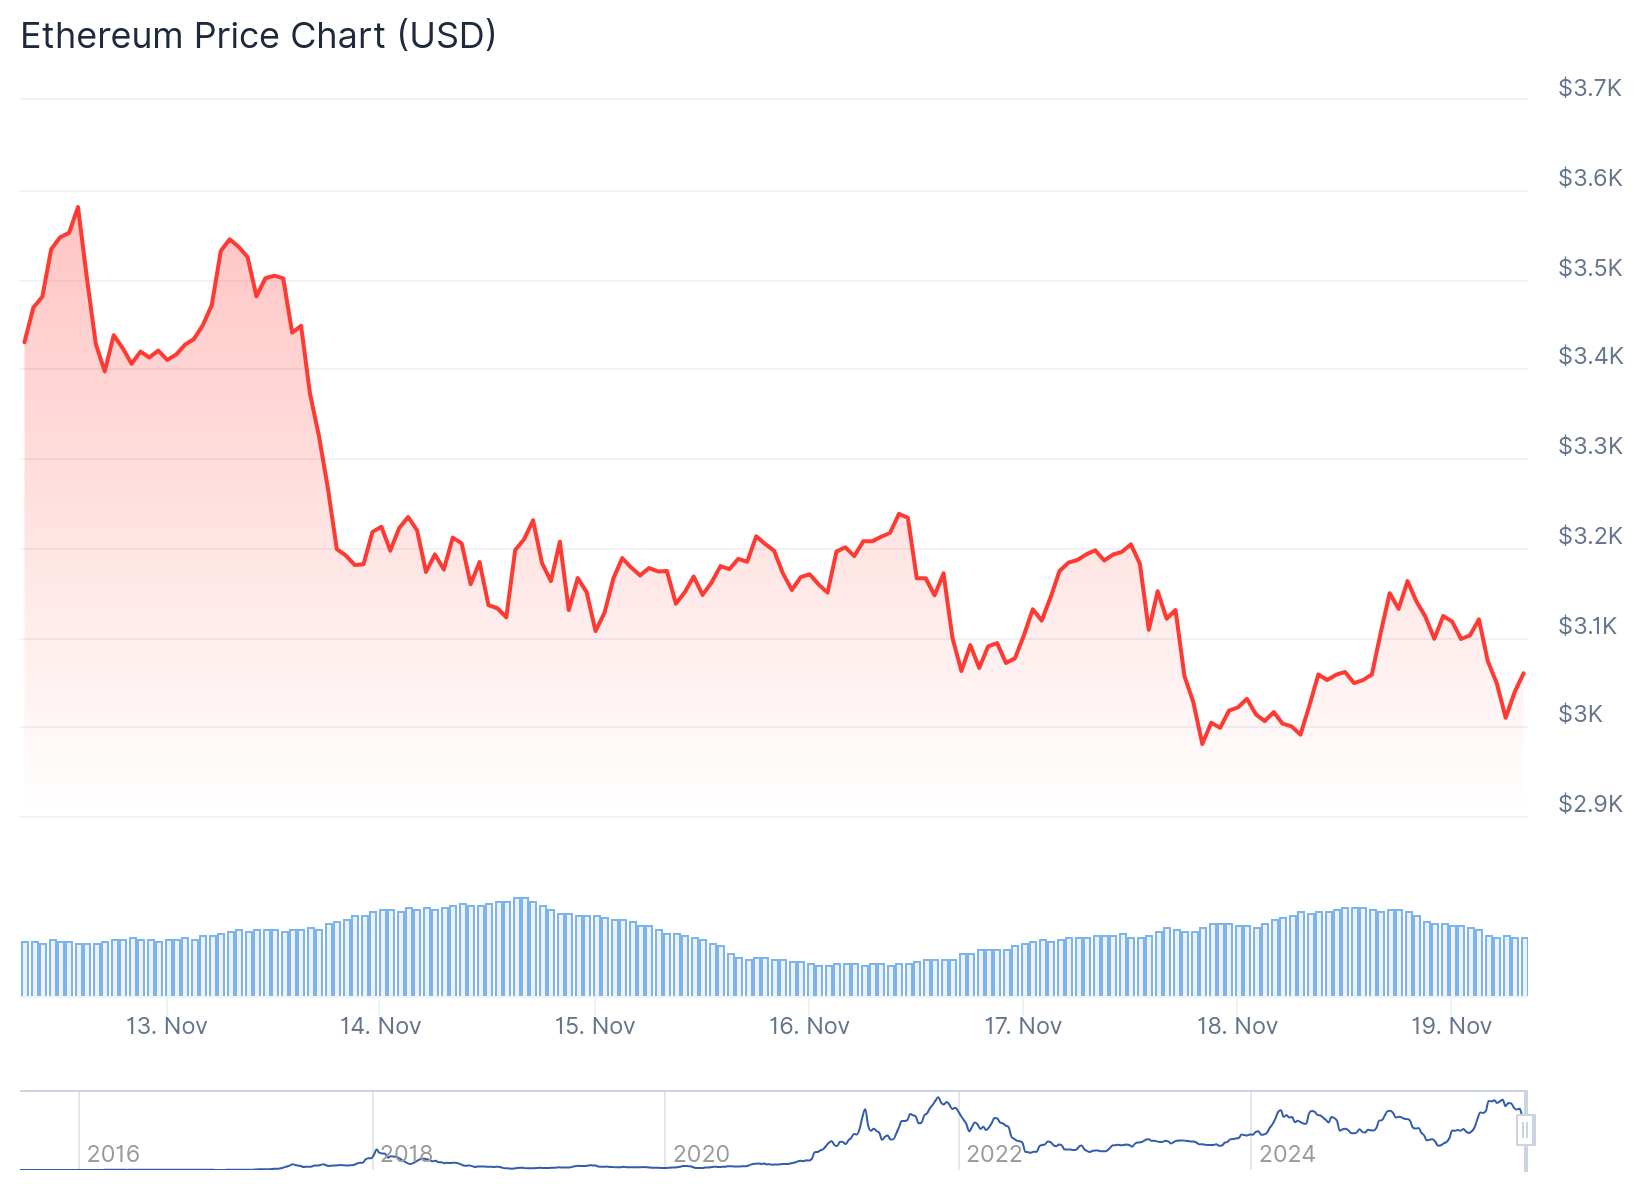
This marks the first time ETH has traded at this price point since July 15. The decline has created a clear daily downtrend with consecutive lower highs and lower lows.
The Mayer Multiple indicator has dropped below 1 for the first time since mid-June. This metric measures the ratio between ETH’s current price and its 200-day moving average.
A reading below 1 indicates Ether is trading at a discount compared to its long-term trend. Throughout ETH’s history, this has typically indicated long-term bottoms. The main exception was January 2022, when a broader bear market kept the metric suppressed.
Short-Term Volatility Expected
Liquidity data from Hyblock Capital shows several dense long-liquidation clusters below the current price. The next two clusters sit at $2,904 to $2,916 and $2,760 to $2,772.

This suggests the market may need to sweep these levels before forming a durable base. The overall liquidity structure has fully reset according to analytics platform Altcoin Vector.
This condition has historically appeared before every major bottom. Liquidity collapses tend to precede multi-week bottoming phases rather than immediate breakdowns.

The correction window remains open as long as liquidity rebuilds. If replenishment occurs in the coming weeks, ETH could enter its next expansion phase.
Tom Lee Forecasts Bottom This Week
FundStrat founder Tom Lee believes Ethereum will bottom this week. He pointed to the ratio of Ethereum price to total value locked reaching about 50%.
Lee also cited Ethereum’s low ratio to Bitcoin as a bullish signal. He made long-term predictions ranging from $12,000 to $62,000 depending on various scenarios.
The $62,000 target assumes Ethereum becomes the global payment rail. This would push its market capitalization to $7.45 trillion.
Technical Pattern Suggests Rebound
The daily chart shows a falling wedge pattern forming. This pattern consists of two descending and converging trendlines.
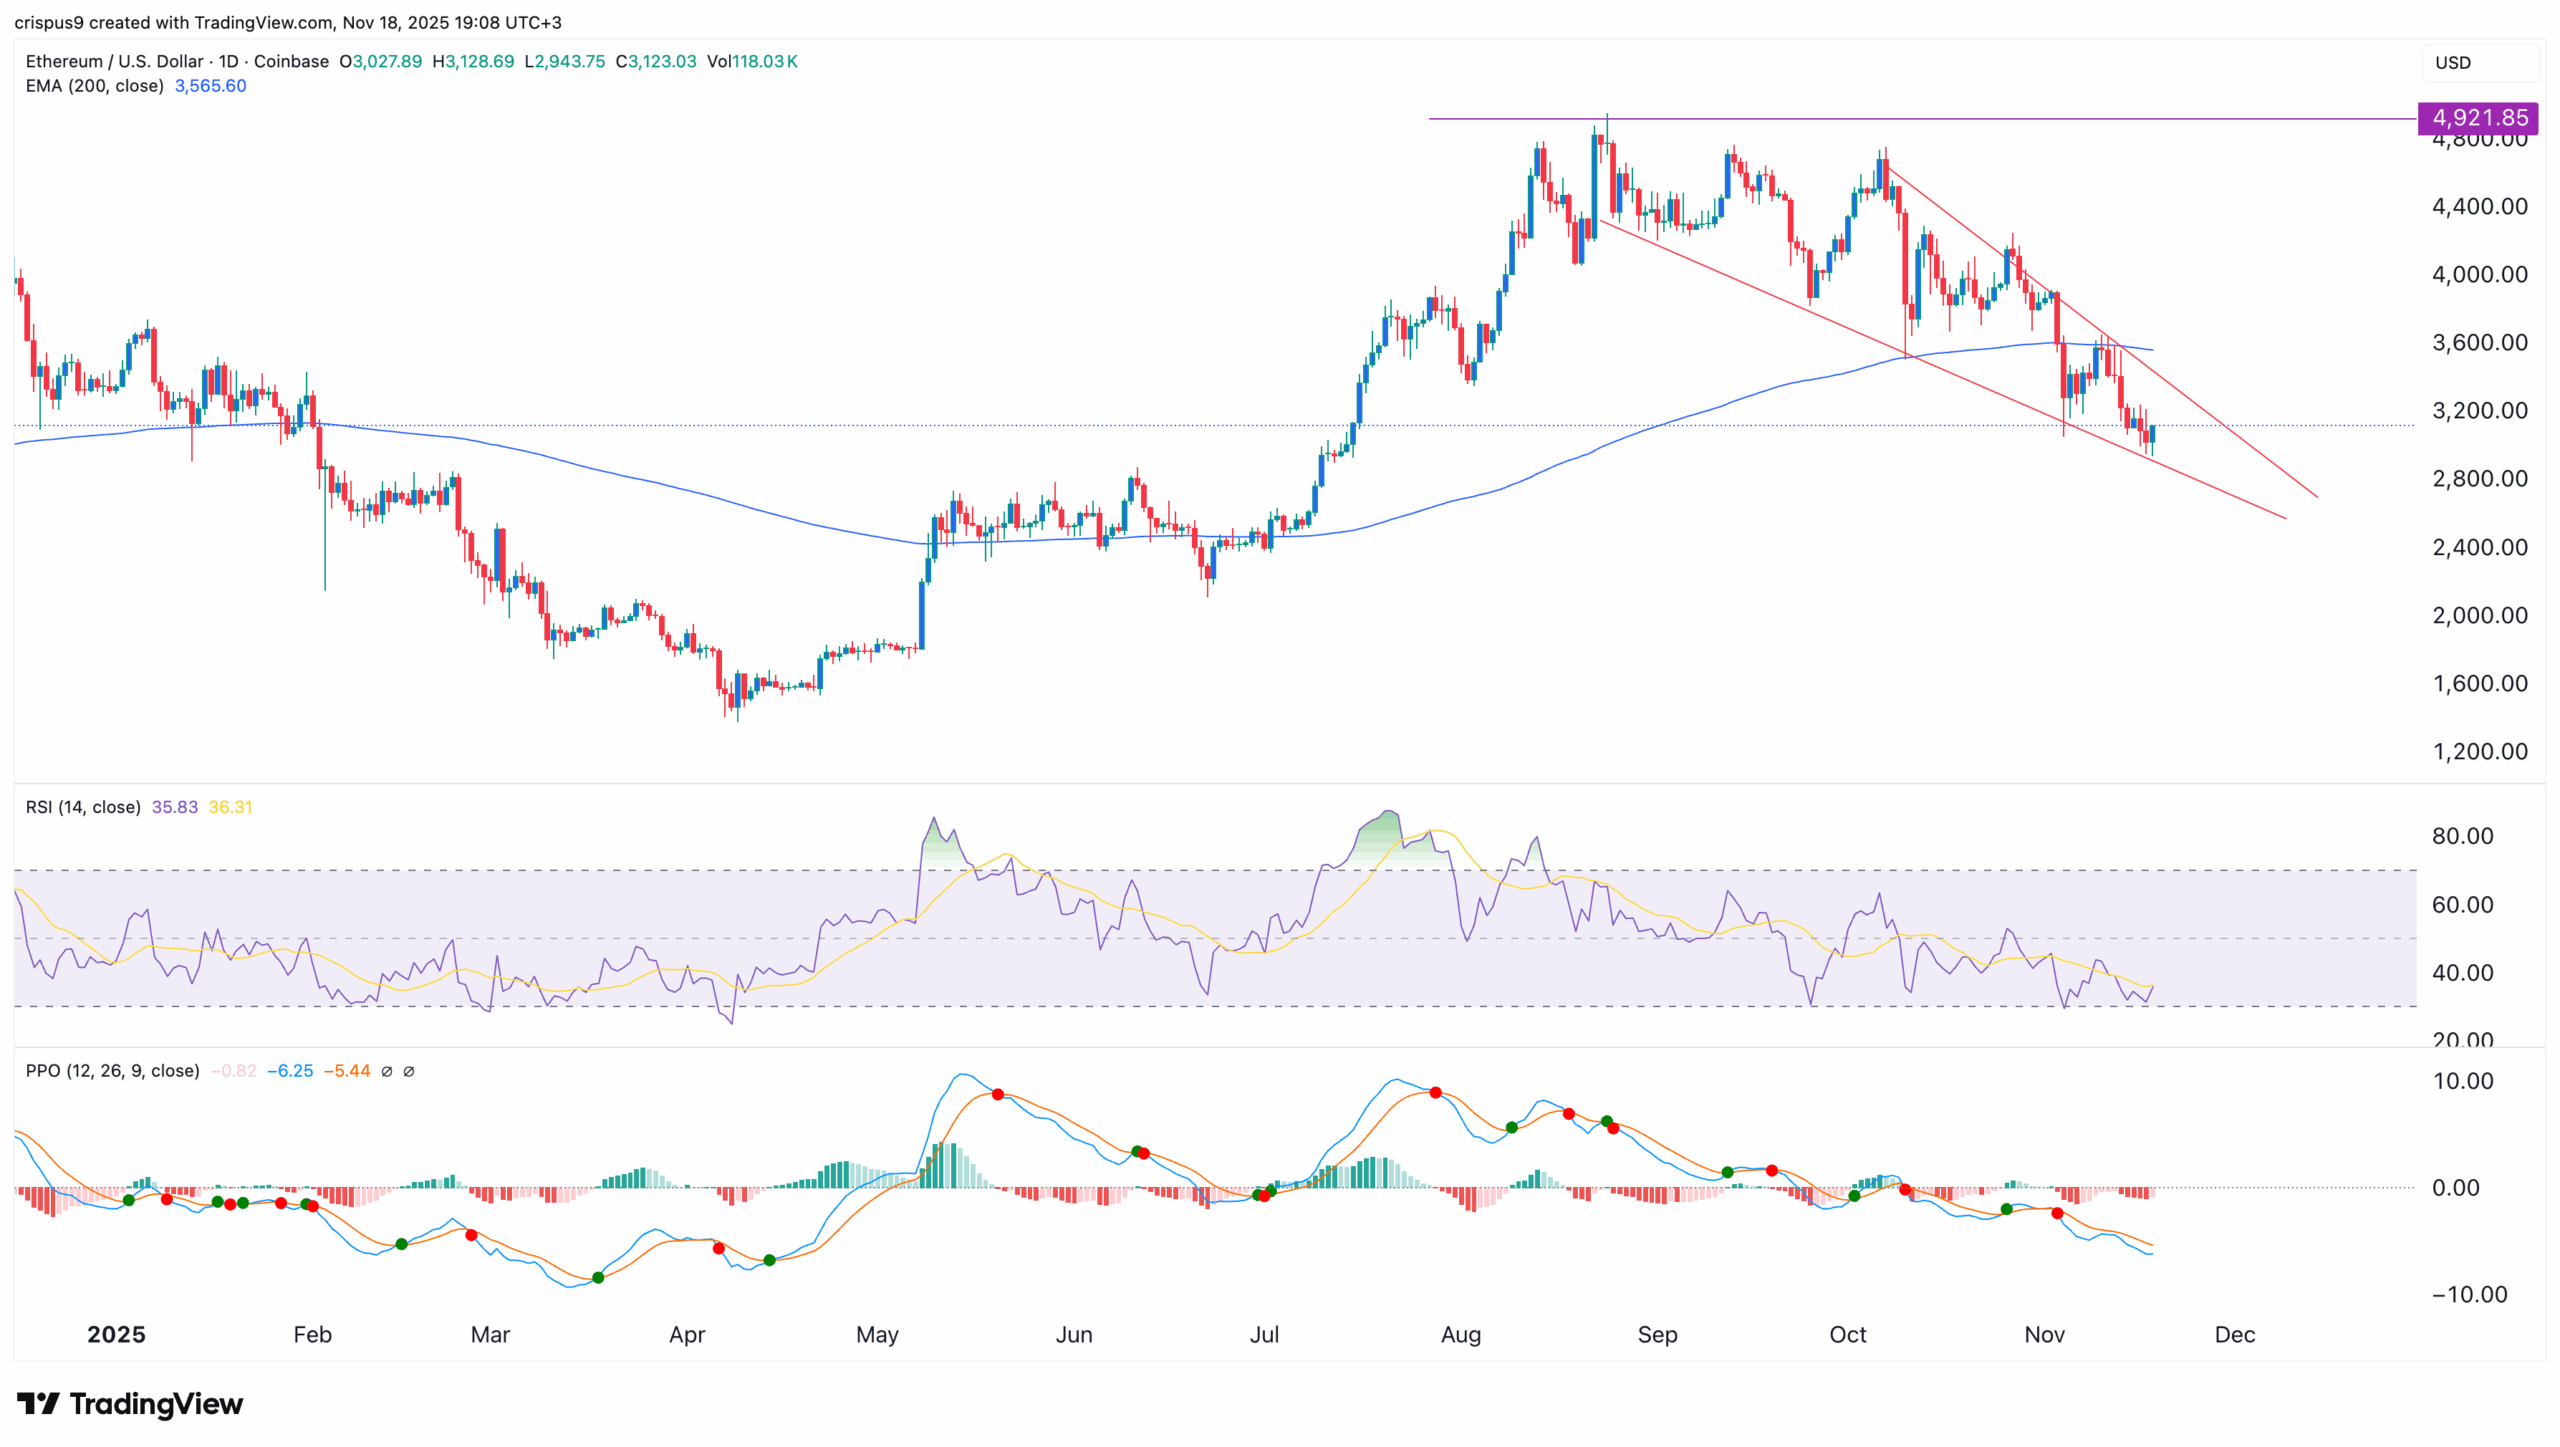
The trendlines are nearing their confluence point. This typically signals a potential bullish breakout.
A successful breakout could push the price toward $4,000. This represents a 28% gain from current levels.
The Relative Strength Index has moved closer to oversold territory. The Percentage Price Oscillator has also continued declining.
Ethereum has moved below its 200-day Exponential Moving Average during the recent decline. A drop below $2,900 would invalidate the bullish scenario and suggest more downside ahead.
Ethereum currently holds a 63% market share in the real-world asset tokenization industry. Over $11 billion in assets have been tokenized on its network by companies including BlackRock, Franklin Templeton, and Janus Henderson.


