


 Price: Bulls Target $4K as ETF Inflows Rise and Supply Drops")


TLDR
-
Ethereum is trading around $3,792, down 2.42% in 24 hours, but weekly gains show +1.78% resilience.
-
Trading volume is up 16.04%, signaling strong market participation despite the pullback.
-
$4,000 remains a key resistance, while support lies near $3,510–$3,000.
-
ETF inflows hit $5.12 billion in July, showing strong institutional conviction.
-
A break above $3,919 could trigger a push toward $4,173–$4,874, or risk correction if rejected.
Ethereum (ETH) is trading at $3,792 after a 2.42% daily decline. Weekly performance shows a gain of 1.78%, keeping the uptrend intact.
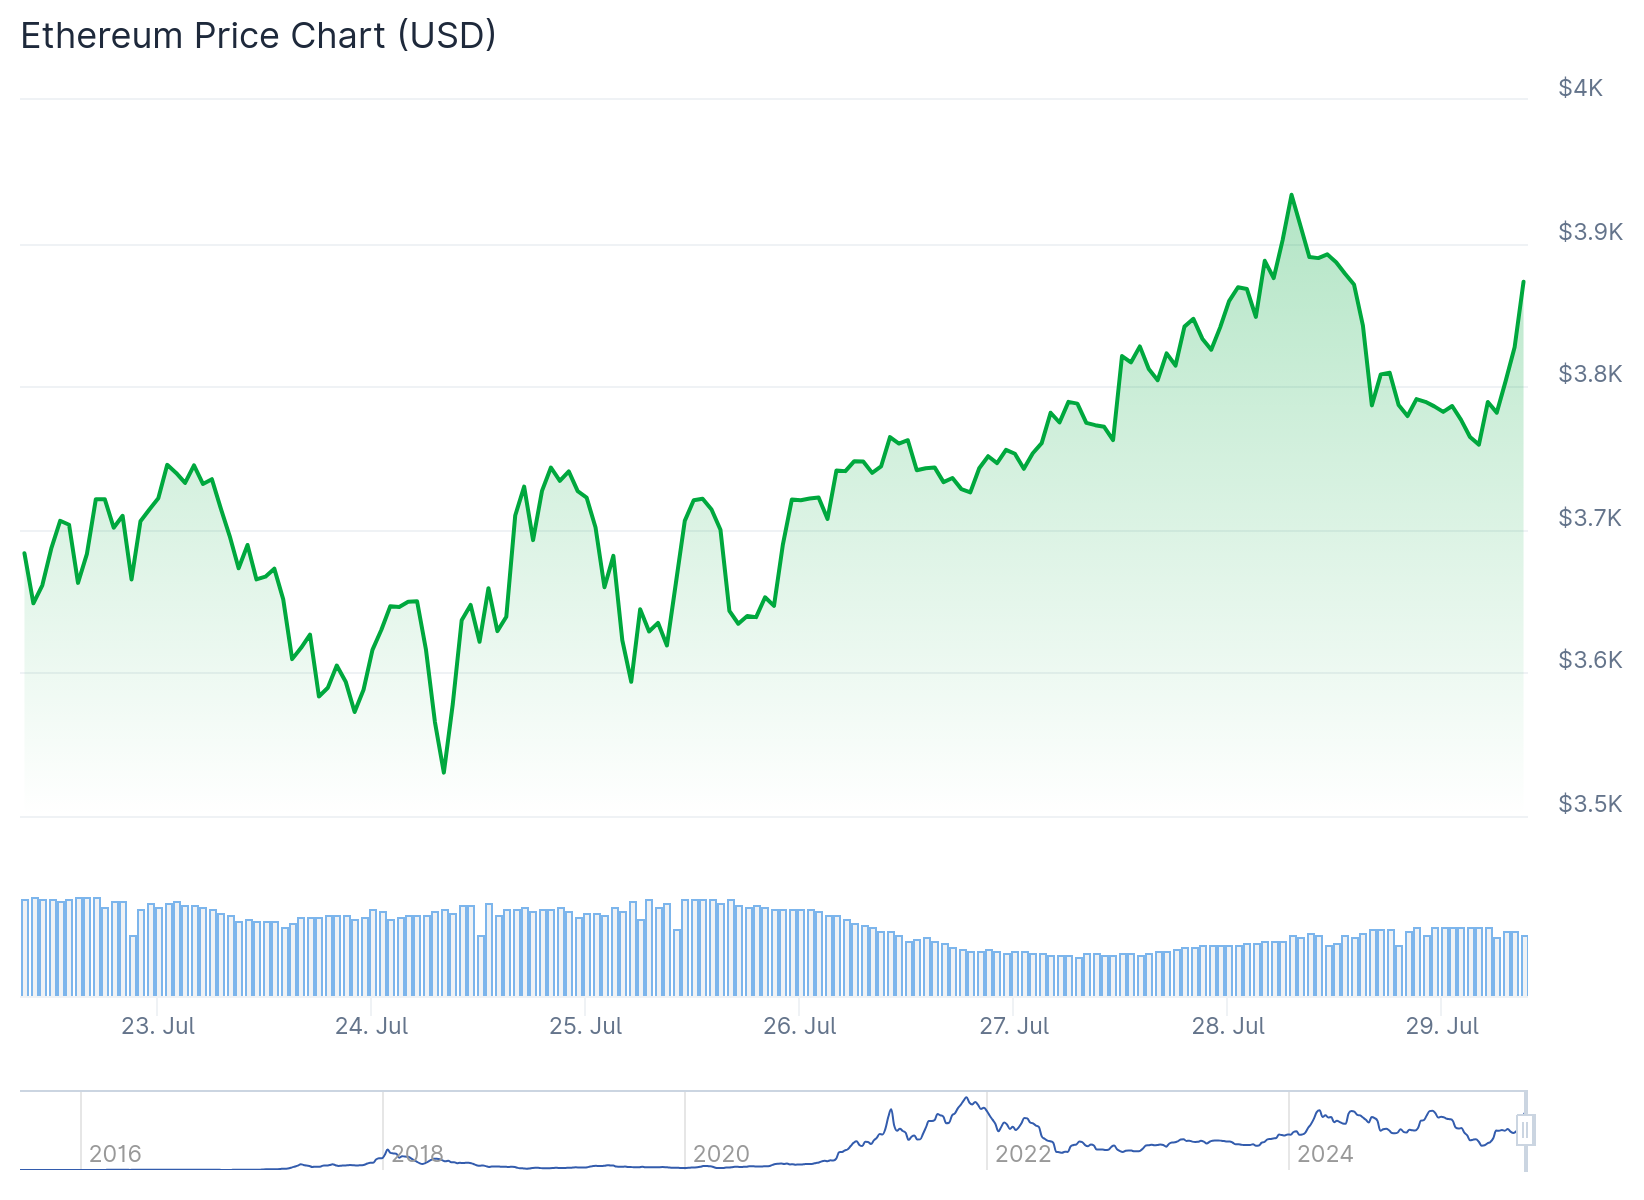
Trading volume rose 16.04% to $36.84 billion. This signals active investor interest despite the recent dip.
Key support sits at $3,510, with deeper support at $3,000 and $2,760. Resistance remains at $4,000 and the crucial Fib level at $3,919.
If ETH breaks $3,919, it could open the path toward $4,173 and higher Fibonacci levels. These include $4,378, $4,583, and $4,874 as potential upside targets.
ETF Inflows and Exchange Supply
Institutional interest is rising sharply. ETH Spot ETFs brought in $5.12 billion in July—the strongest inflows in a year.
At the same time, exchange reserves are at their second-lowest point in over 12 months. This drop suggests lower sell pressure and steady demand from both retail and institutional buyers.
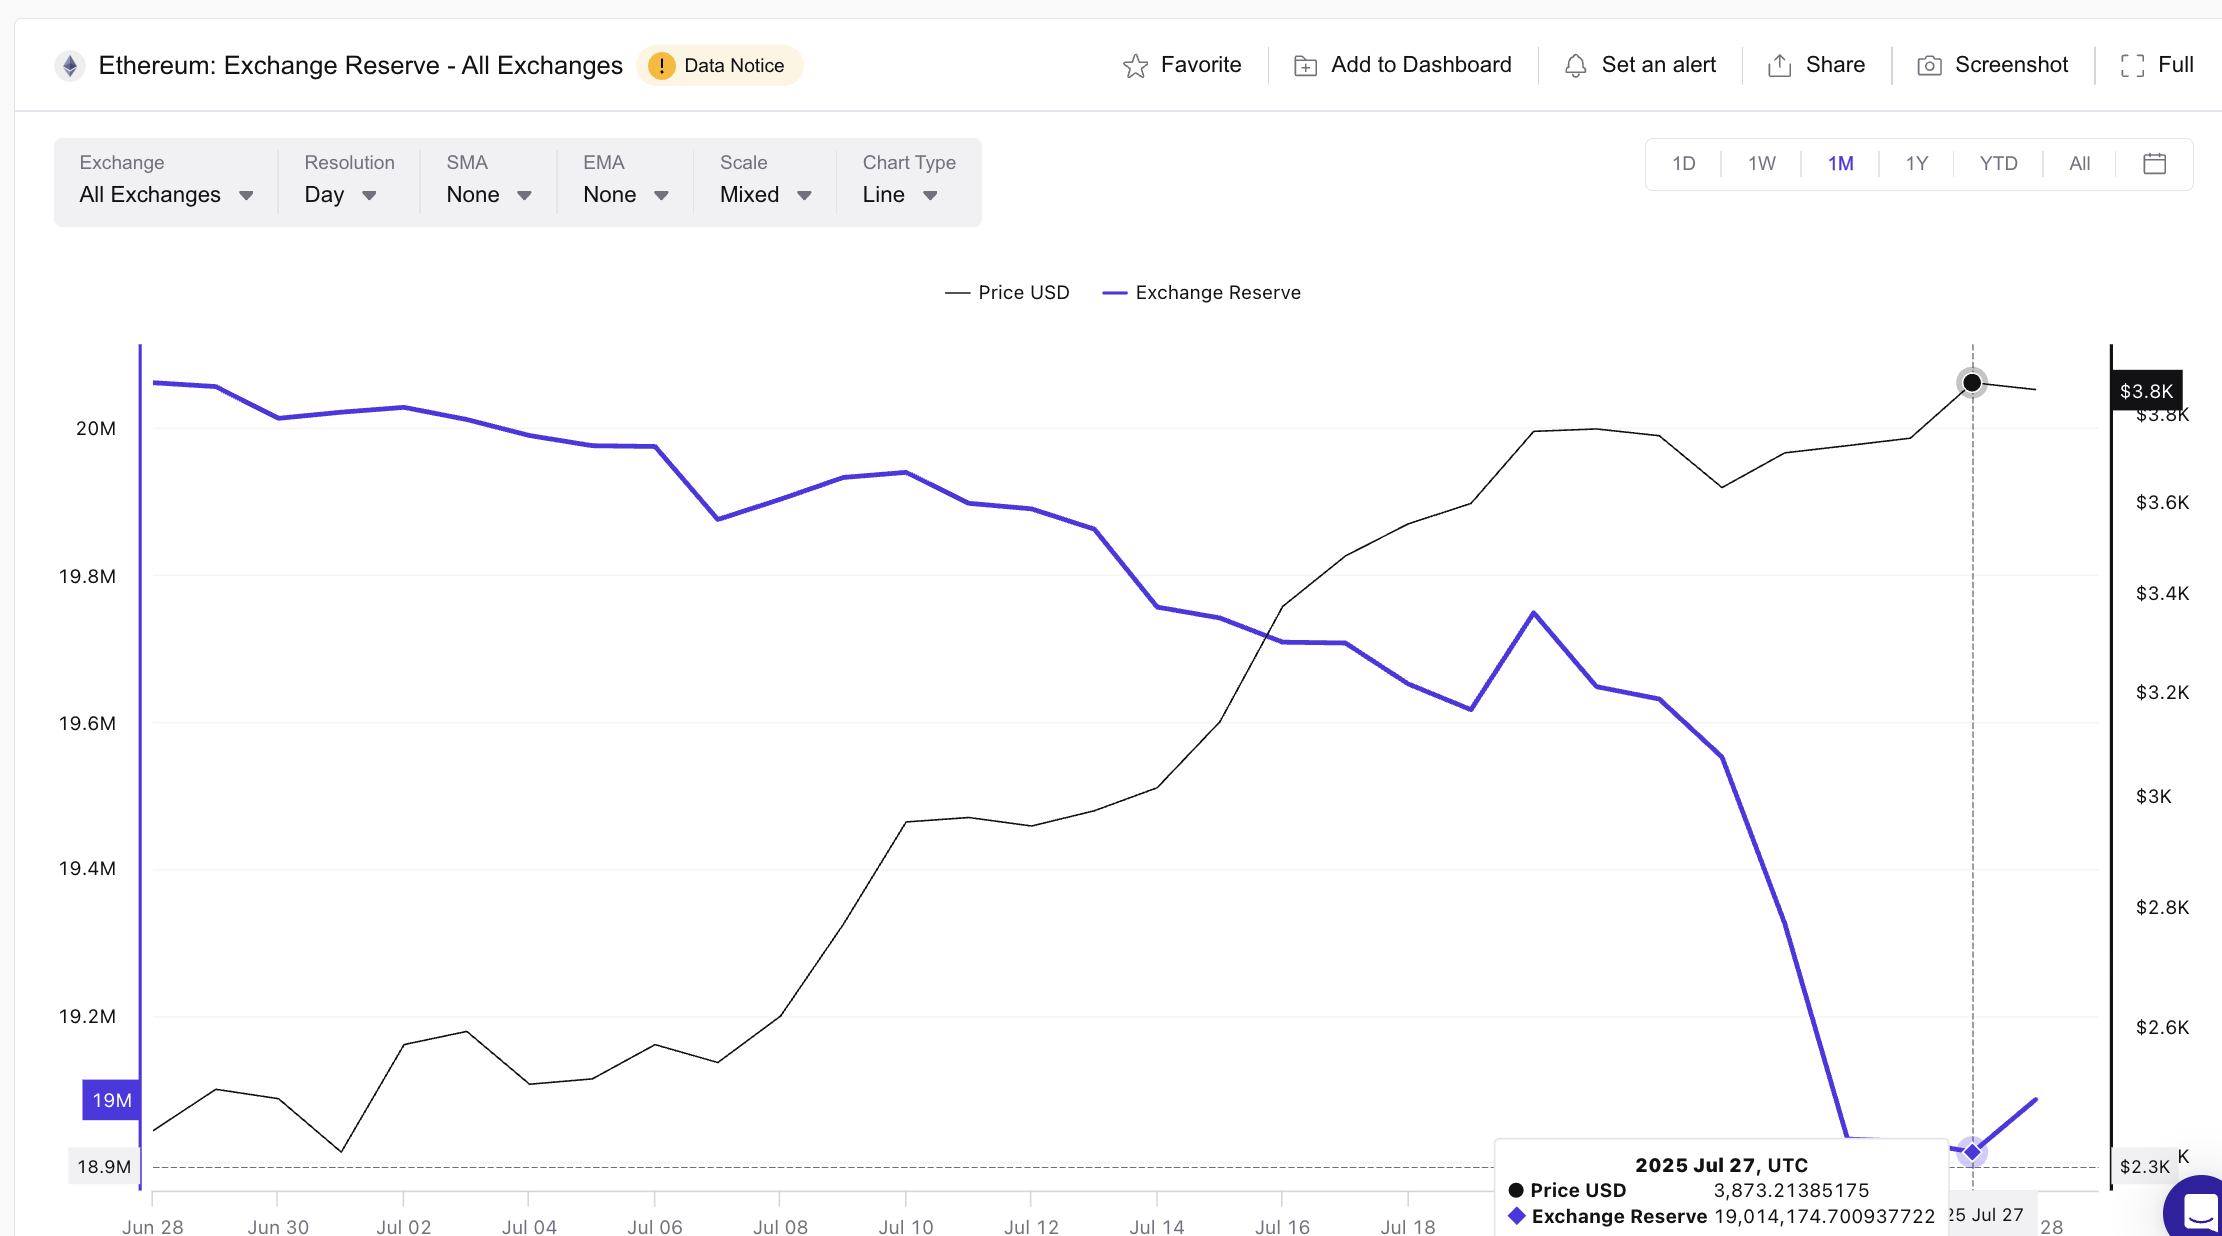
Even with wallet selling, exchange supply hasn’t risen. This implies absorption, where buyers are soaking up sales quickly.

Such conditions often support bullish price action. Combined with ETF demand, this could help ETH push through resistance.
Leverage Pressure and RSI Readings
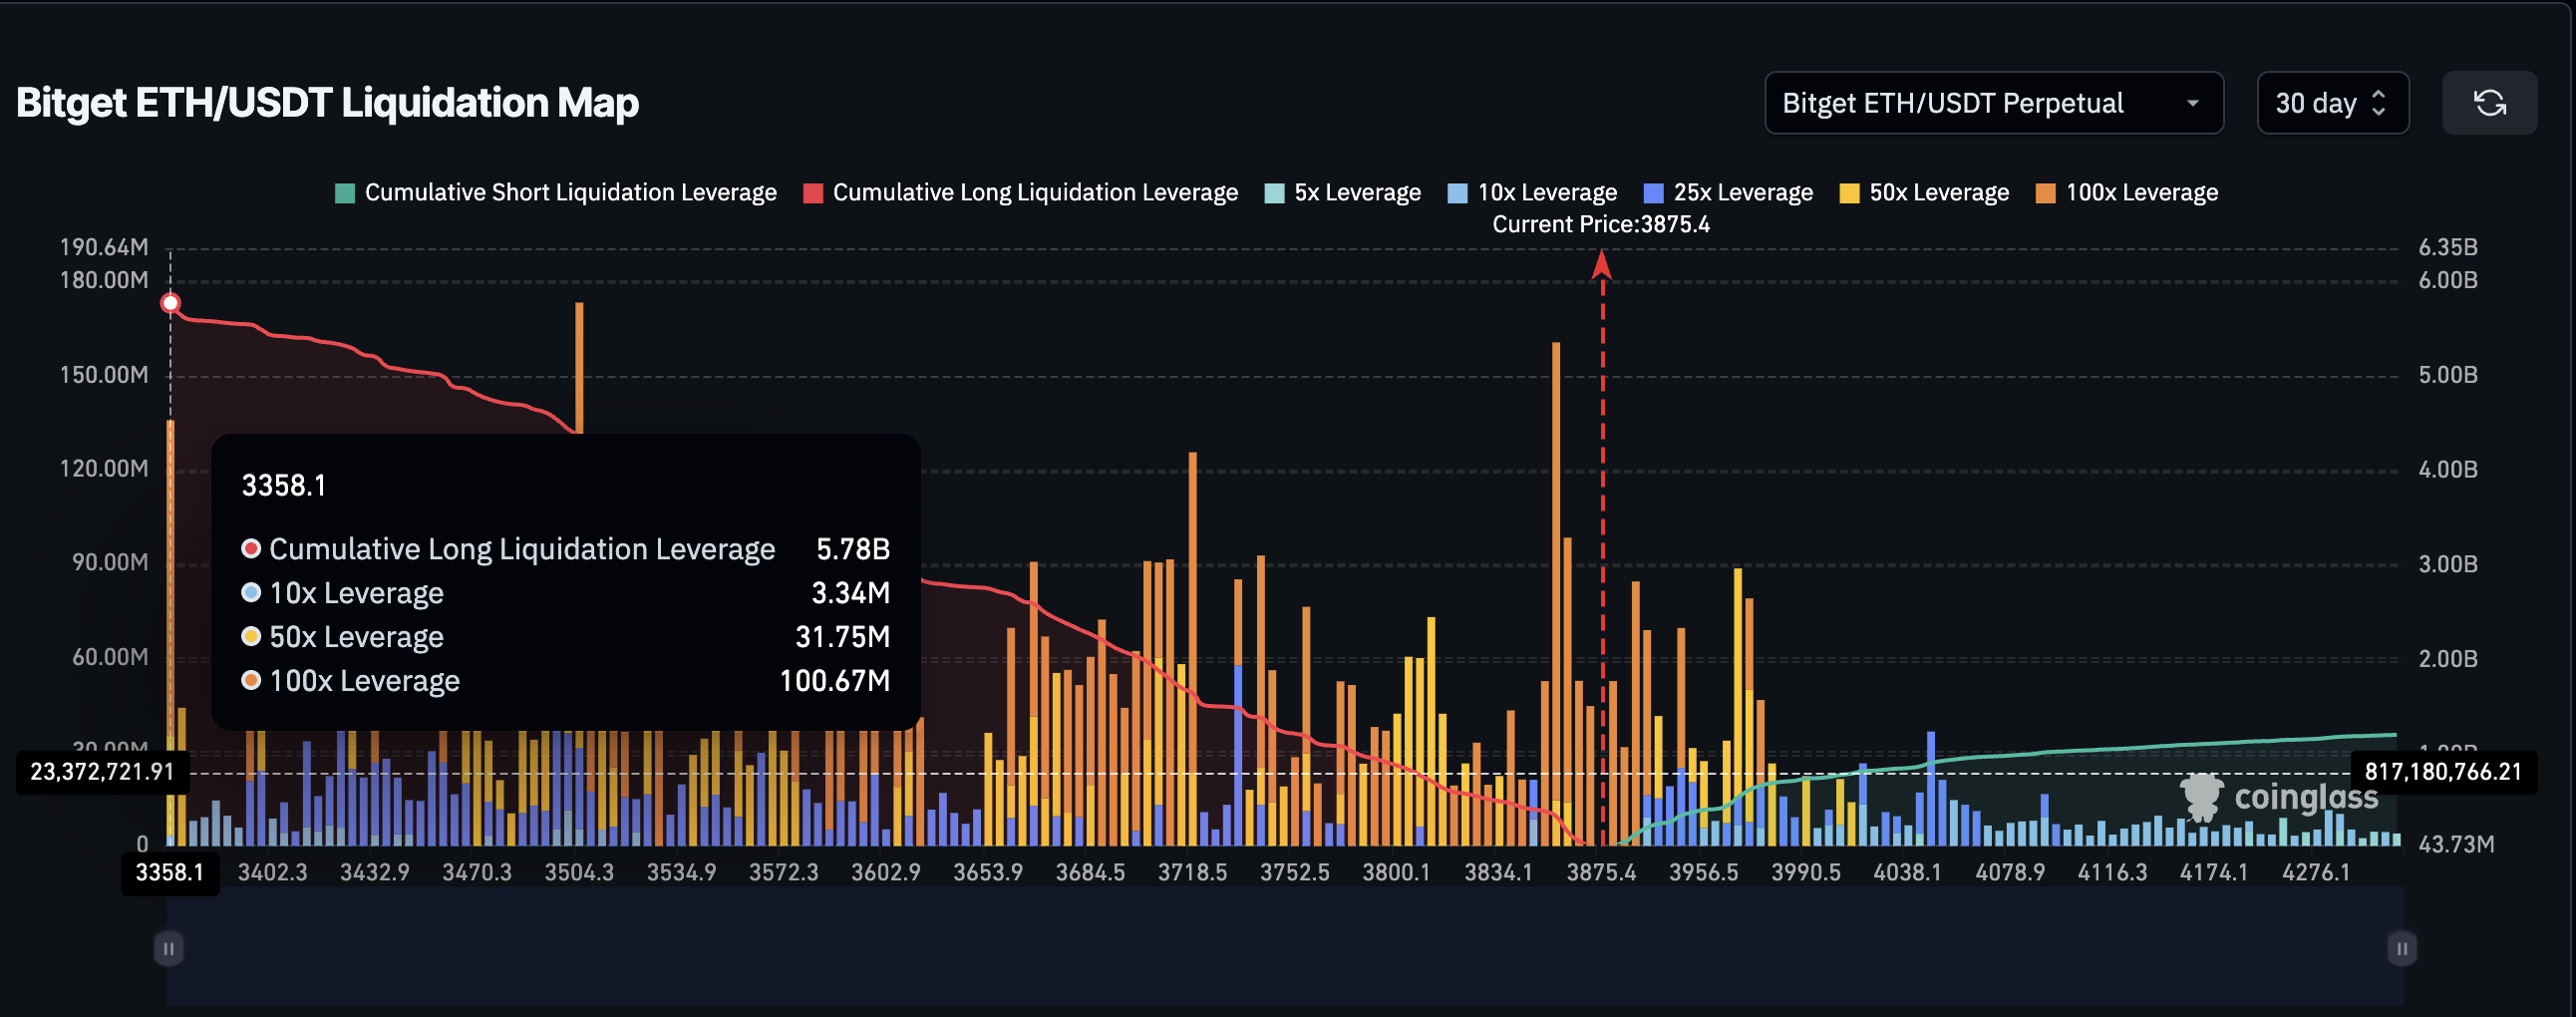
Ethereum is trading near a heavy leverage cluster between $3,358 and $3,875. This range holds over $5.78 billion in long positions, which increases risk if ETH loses momentum.
The Relative Strength Index (RSI) sits at 80, approaching overbought territory. This suggests ETH may need a brief cooldown before any next move.
Ethereum price has already climbed above its 200-day Simple Moving Average (SMA). Analysts suggest that a retracement to around $3,500 could offer a fresh entry for another push.
Overbought at Resistance — $4K in Sight, But Momentum Slowing
▪️ Broke above 200 SMA, $3,000 & $3,450 ➜ Targeting $4,000
▪️ Pattern: Overbought at Resistance
▪️ RSI > 80 ➜ Very Overbought ⚠️
▪️ MACD Histogram declining ➜ Momentum fading
▪️ Resistance: $4,000
▪️ Support:… pic.twitter.com/CjJNxVGDbX— CoinCodeCap Trading (@c3_trading) July 28, 2025
Funding rates remain modest at 0.0081%, showing traders are cautious. Open interest has dipped slightly by 1.43% to $57.65 billion.
The ETH/BTC ratio has surged to 0.032. A golden crossover between moving averages is nearly complete, which could confirm a bullish structure for altcoins.
If that final crossover hits, it may reinforce Ethereum’s momentum. ETH/USD has historically followed ETH/BTC gains.
As of now, Ethereum price is challenging the 0.236 Fibonacci level at $3,919. A breakout here could trigger short liquidations and rapid upside movement.
If the price fails to hold above this mark, a pullback to $3,510 may follow. This level becomes key for bulls to defend the current structure.
Final Thoughts
Ethereum price is at a key point near $3,800. Strong ETF inflows, falling exchange reserves, and technical setups suggest bullish potential, but $3,919 must break for further gains.


