


 Price: Can Bulls Reclaim $4,000 After Record Sell-Off?")


TLDR
- Ethereum’s Net Taker Volume hit -$418.8 million, marking the second-largest daily sell-side imbalance on record
- ETH price dropped 1.33% in 24 hours and 3.63% over the week, currently trading around $3,621-$3,643
- Network activity shows strength with new addresses up 29.94% and active addresses climbing 3.17%
- Key resistance at $3,817-$3,950 must be broken for potential move toward $4,000 target
- Long-term holders maintain strong conviction with MVRV Long/Short Difference above 12.36%
Ethereum price analysis reveals a cryptocurrency caught between conflicting market forces as ETH navigates bearish sell pressure and underlying network strength. The world’s second-largest cryptocurrency by market cap has experienced recent volatility in trading sessions.
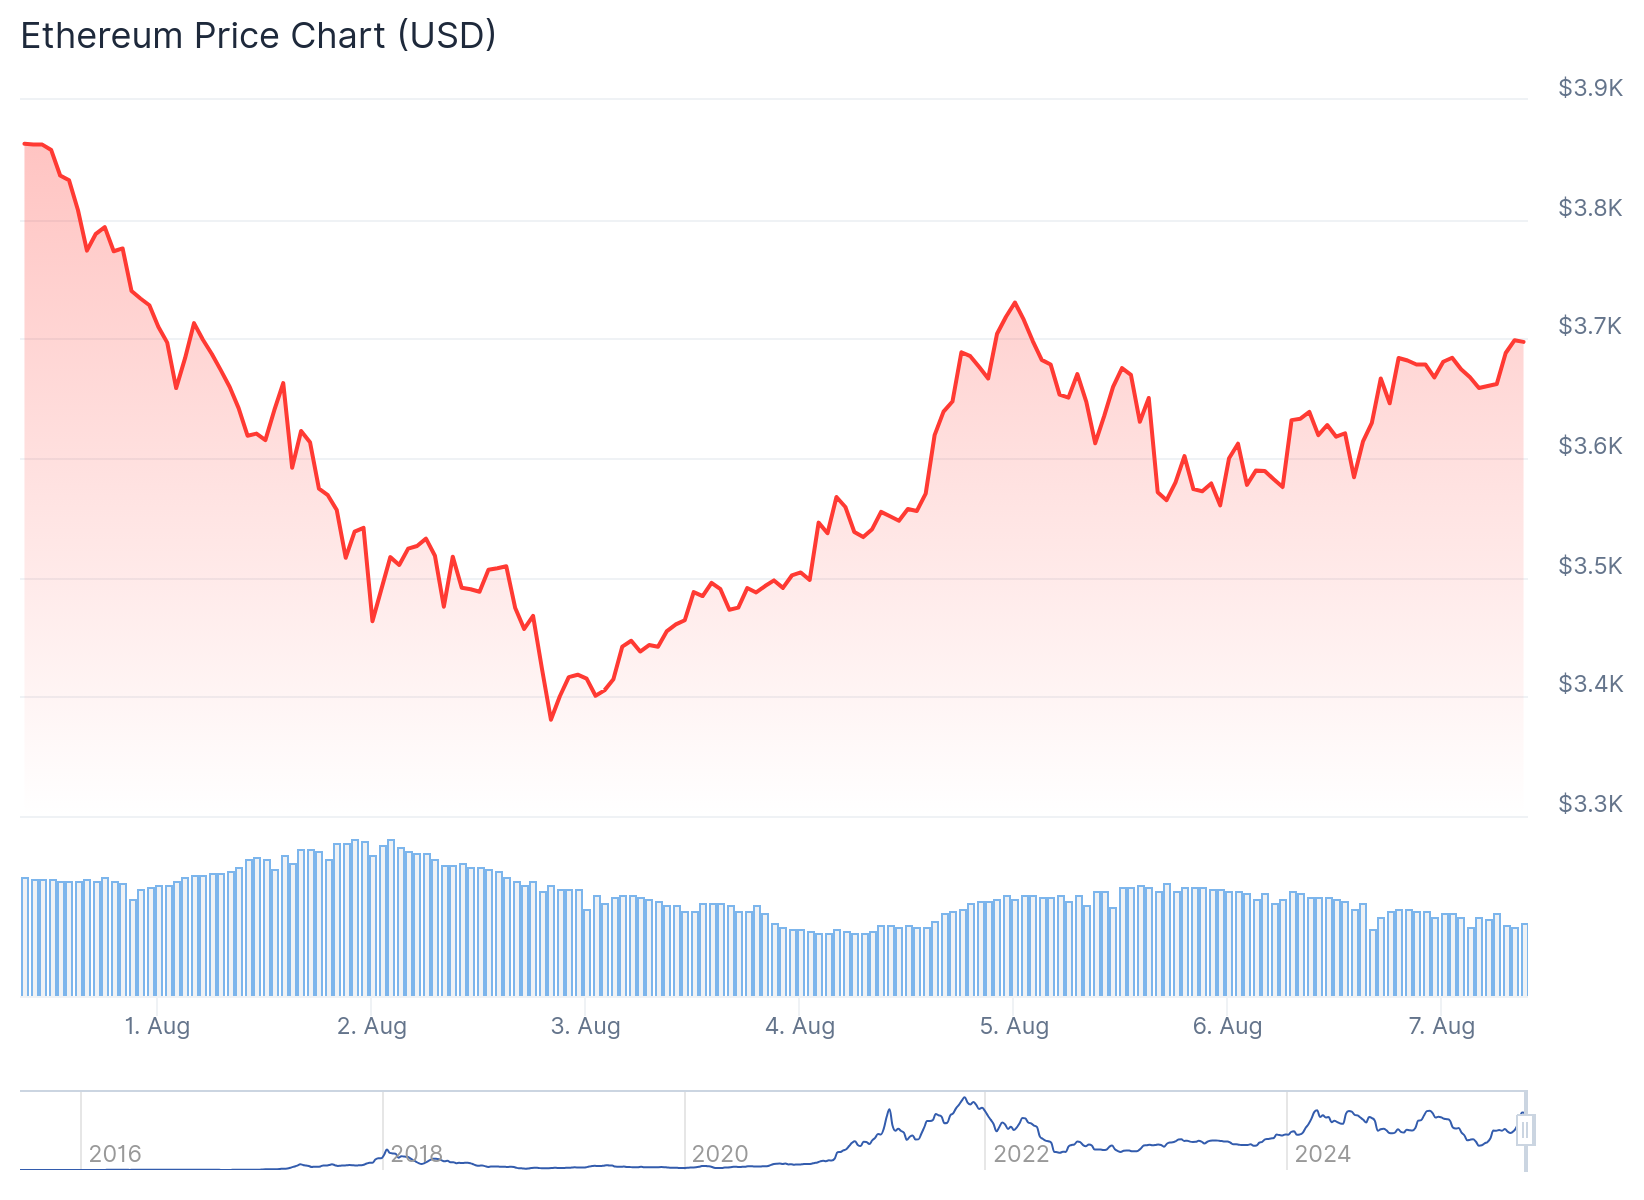
ETH price dropped 1.33% in the past 24 hours and declined 3.63% over the last week. Ethereum is currently trading between $3,621 and $3,643, demonstrating relative stability despite ongoing selling activity.
Ethereum trading volume reached $30.37 billion daily, representing a 9% decrease from the previous day. This volume decline suggests cryptocurrency market activity has moderated across ETH markets.

The most pressing concern for Ethereum price comes from institutional sell-side pressure data. ETH Net Taker Volume plunged to -$418.8 million, marking the second-largest daily sell-side imbalance ever recorded according to CryptoQuant analysis.
This Ethereum metric indicates that 116,000 more ETH tokens were sold than bought in a single trading day. Such extreme cryptocurrency selling levels have historically preceded local price tops and often signal potential market reversal points.
Despite heavy Ethereum selling pressure, buyers continue to absorb supply at current ETH price levels. This absorption suggests sustained demand for Ethereum around the $3,600 cryptocurrency support range.
Ethereum Price Technical Analysis Points to Key Resistance Levels
From an ETH technical analysis perspective, Ethereum recently completed a cup and handle formation pattern. This cryptocurrency chart pattern typically signals bullish continuation when properly executed for digital assets.


However, Ethereum price failed to break above the neckline resistance at $3,950. Instead, ETH has consolidated within a descending channel formation on cryptocurrency charts.
The Ethereum Relative Strength Index (RSI) currently stands at 57, indicating neutral momentum for the cryptocurrency. This ETH reading suggests neither buyers nor sellers have clear control over Ethereum price direction.
Cryptocurrency analyst Ted highlighted that the next important Ethereum barrier sits at $3,817. A break above this ETH level with strong buying support could open the door for Ethereum price movement toward $4,000.
$ETH trading within top range.
Would like to see momentum into the highs again.
With enough momentum we can send Ethereum to $4,000. 🤝 pic.twitter.com/lGSXHbgIYG
— Ted (@TedPillows) August 6, 2025
If ETH manages to reclaim the $3,950 resistance level, it could validate the bullish cup and handle pattern for Ethereum. Failure to break these cryptocurrency levels may lead to further ETH price retracement.
On the downside, Ethereum support exists around $3,396. A break below this ETH zone could send Ethereum price toward the $3,144 level, where cryptocurrency buyers previously provided support.
Ethereum Network Activity Shows Underlying Strength
Despite bearish ETH price action, Ethereum on-chain metrics paint a different cryptocurrency picture. Network activity has increased across key Ethereum indicators.
New addresses on the Ethereum network surged 29.94% according to IntoTheBlock blockchain data. This growth in new ETH users suggests continued adoption of the Ethereum platform.
Active Ethereum addresses also climbed 3.17%, showing that existing users remain engaged with the ETH network. These cryptocurrency metrics often provide strong foundations for Ethereum price stability and future recovery.
The divergence between declining ETH price and rising Ethereum network activity may indicate underlying cryptocurrency strength. Historical blockchain data shows that increased address growth often supports Ethereum price rebounds during market downturns.
Long-term Ethereum holders appear to maintain confidence in ETH valuation. The MVRV Long/Short Difference remains above 12.36%, showing that long-term cryptocurrency investors hold sizable unrealized gains.
This Ethereum metric reflects strong conviction from experienced market participants despite recent ETH weakness. Their continued holding pattern provides Ethereum price support during volatile cryptocurrency periods.
However, the Ethereum NVT Ratio with Circulation has increased, suggesting ETH market cap is outpacing transaction activity. This reading typically indicates short-term overvaluation concerns for the cryptocurrency.
Ethereum market derivatives data shows mixed signals for future ETH price direction. Open interest fell 4.28% to $46.76 billion, indicating some cryptocurrency position unwinding.
The ETH funding rate remains slightly positive at 0.0085%, suggesting cautious optimism among Ethereum futures traders. This reading shows traders are willing to pay small premiums for long ETH positions.
Ethereum must navigate between these competing cryptocurrency forces in the coming trading sessions. ETH sits at a critical juncture between key support and resistance levels.
Ethereum price action over the next few days will determine whether buyers can push ETH higher or if recent selling will trigger deeper retracement. Current ETH trading volume at $90.41 billion shows continued institutional interest despite the recent decline.


