


 Price: Correction Follows Failed $4,800 Breakout Attempt – What’s Next?")


TLDR
- Ethereum failed to break through resistance at $4,800 and dropped 3% below $4,500 after a bearish divergence appeared on charts
- Spot selling pressure increased while futures traders remained active, showing mixed market signals
- Exchange reserves fell to 16.1 million ETH, down over 25% since 2022, reducing available supply
- The $4,400-$4,420 zone represents a critical support level where stop orders cluster
- A rebound from support could trigger renewed upward momentum, while failure may push ETH toward $4,100-$4,150
Ethereum price struggled to maintain momentum this week as bulls failed to push through the $4,800 resistance level. The second-largest cryptocurrency by market cap experienced a sharp 3% correction that brought prices below $4,500.
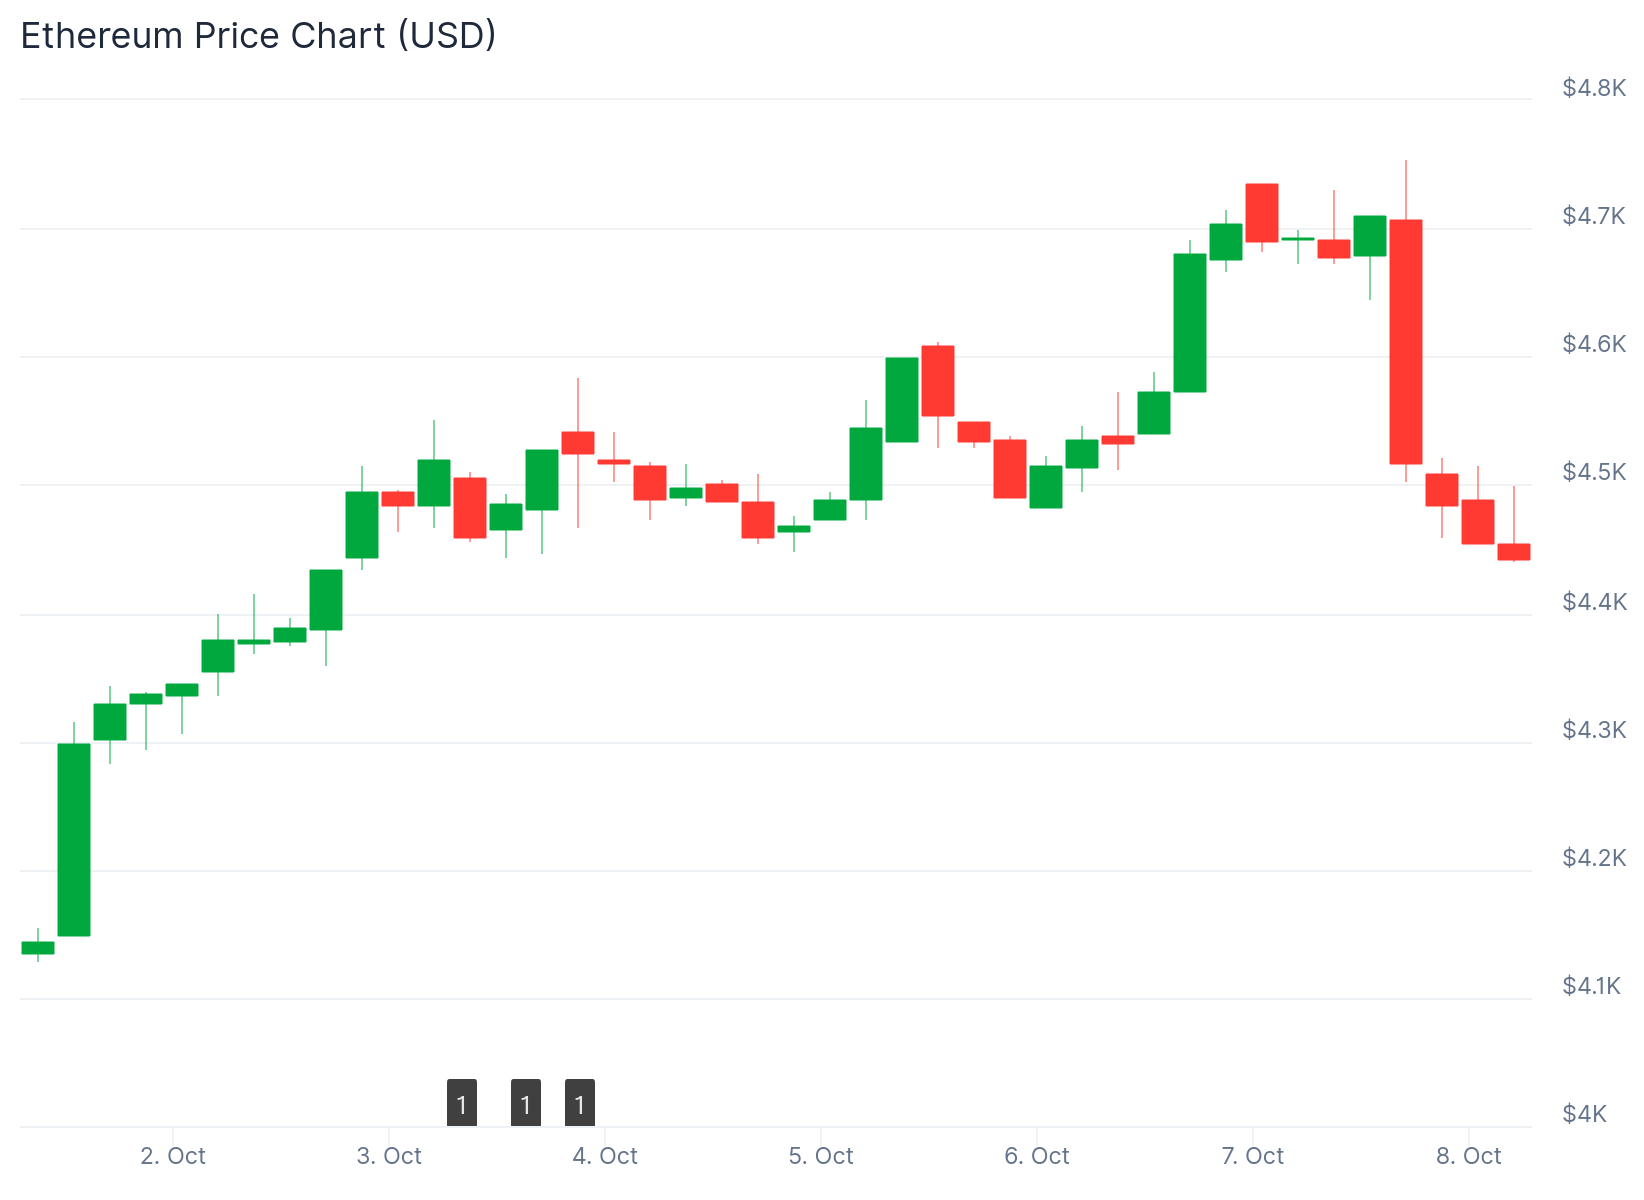
The decline occurred on Tuesday following a bearish divergence on the four-hour chart. This pattern typically signals that buying pressure is weakening. Bitcoin reached a new all-time high on Monday, but Ethereum could not follow suit.
The correction came after ETH tested $4,750 resistance. A high formed at $4,759 before bears took control. The price dropped through $4,620 and $4,600, breaking a key bullish trend line at $4,560.
Data from onchain and derivatives markets shows mixed signals. Spot cumulative volume delta dropped sharply, indicating net selling pressure in the spot market. However, futures open interest and futures CVD remained elevated.
This suggests leveraged traders are still positioning for volatility even as spot buyers take profits. The futures activity indicates traders expect continued price movement in either direction.
Ethereum currently trades below $4,550 and the 100-hourly Simple Moving Average. The price tested the $4,440 zone and is now consolidating losses.
Key Support and Resistance Levels
The $4,400 to $4,420 area represents a critical support zone. Stop orders typically cluster in this region. A strong rebound from this level could invalidate the bearish setup and signal renewed upward movement.

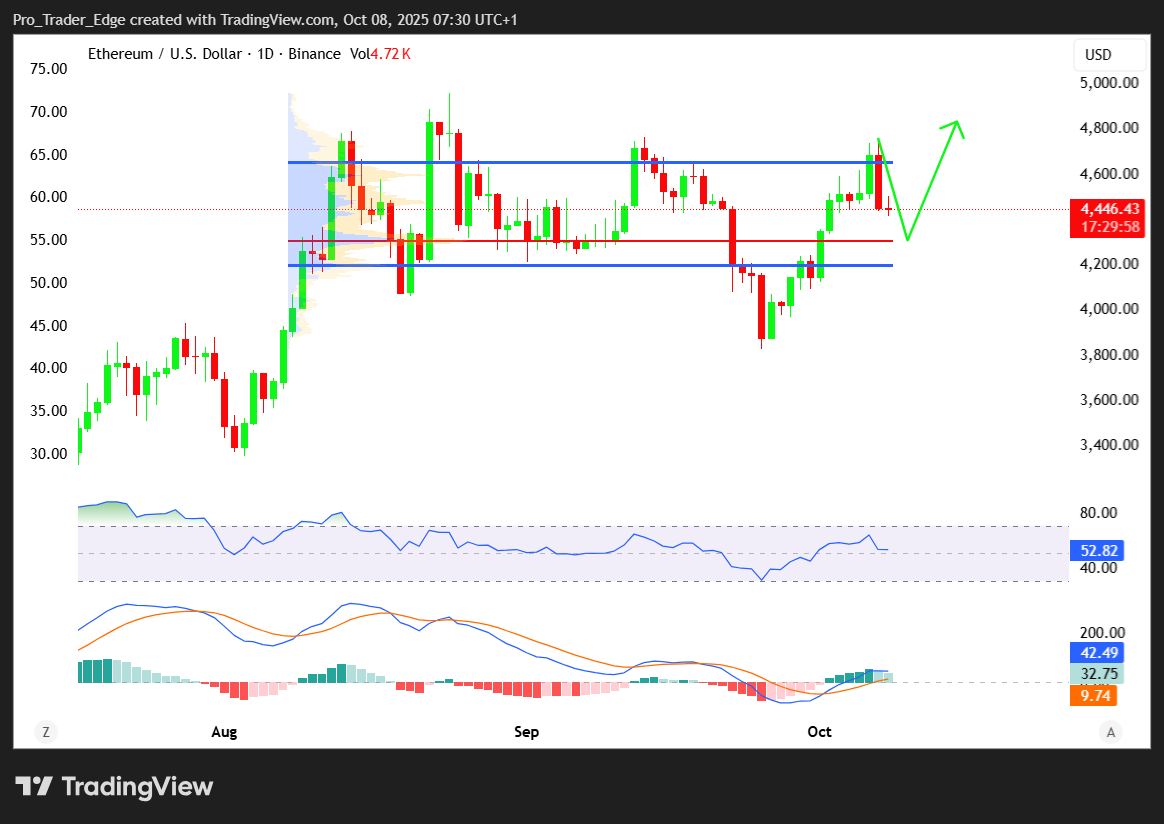
If Ethereum fails to hold this support, the correction could extend to $4,250 or $4,100. These levels coincide with four-hour and one-day order blocks. These zones often represent high-interest demand areas where large buy orders were previously placed.
On the upside, resistance sits at $4,520 and $4,550. The first major resistance level is $4,600. A clear move above this level might send the price toward $4,650 resistance.
An upside break above $4,650 could lead to further gains. Ether might rise toward $4,720 or $4,750 in that scenario.
Exchange Reserves Point to Reduced Supply
Exchange reserves have fallen to around 16.1 million ETH. This represents a decline of over 25% since 2022. The sustained drop reflects reduced sell-side pressure.

Net exchange flows remain negative. This indicates ETH is moving into self-custody and staking. The trend reduces available supply on exchanges.
US M2 money supply has expanded to a record $22.2 trillion according to XWIN Research. Bitcoin has surged over 130% since 2022 in response to this liquidity wave. Ethereum remains up only 15% in comparison.
One crypto trader noted the recent rally marked the fourth test of the $4,700-$4,800 zone. A successful hold of this area would be bullish for future price action.
The hourly MACD for ETH/USD is losing momentum in the bullish zone. The hourly RSI is now below the 50 level. These technical indicators suggest weakening upward pressure in the short term.


