


 Price: ETF Inflows Hit Record $12B as ETH Outperforms Bitcoin")


TLDR
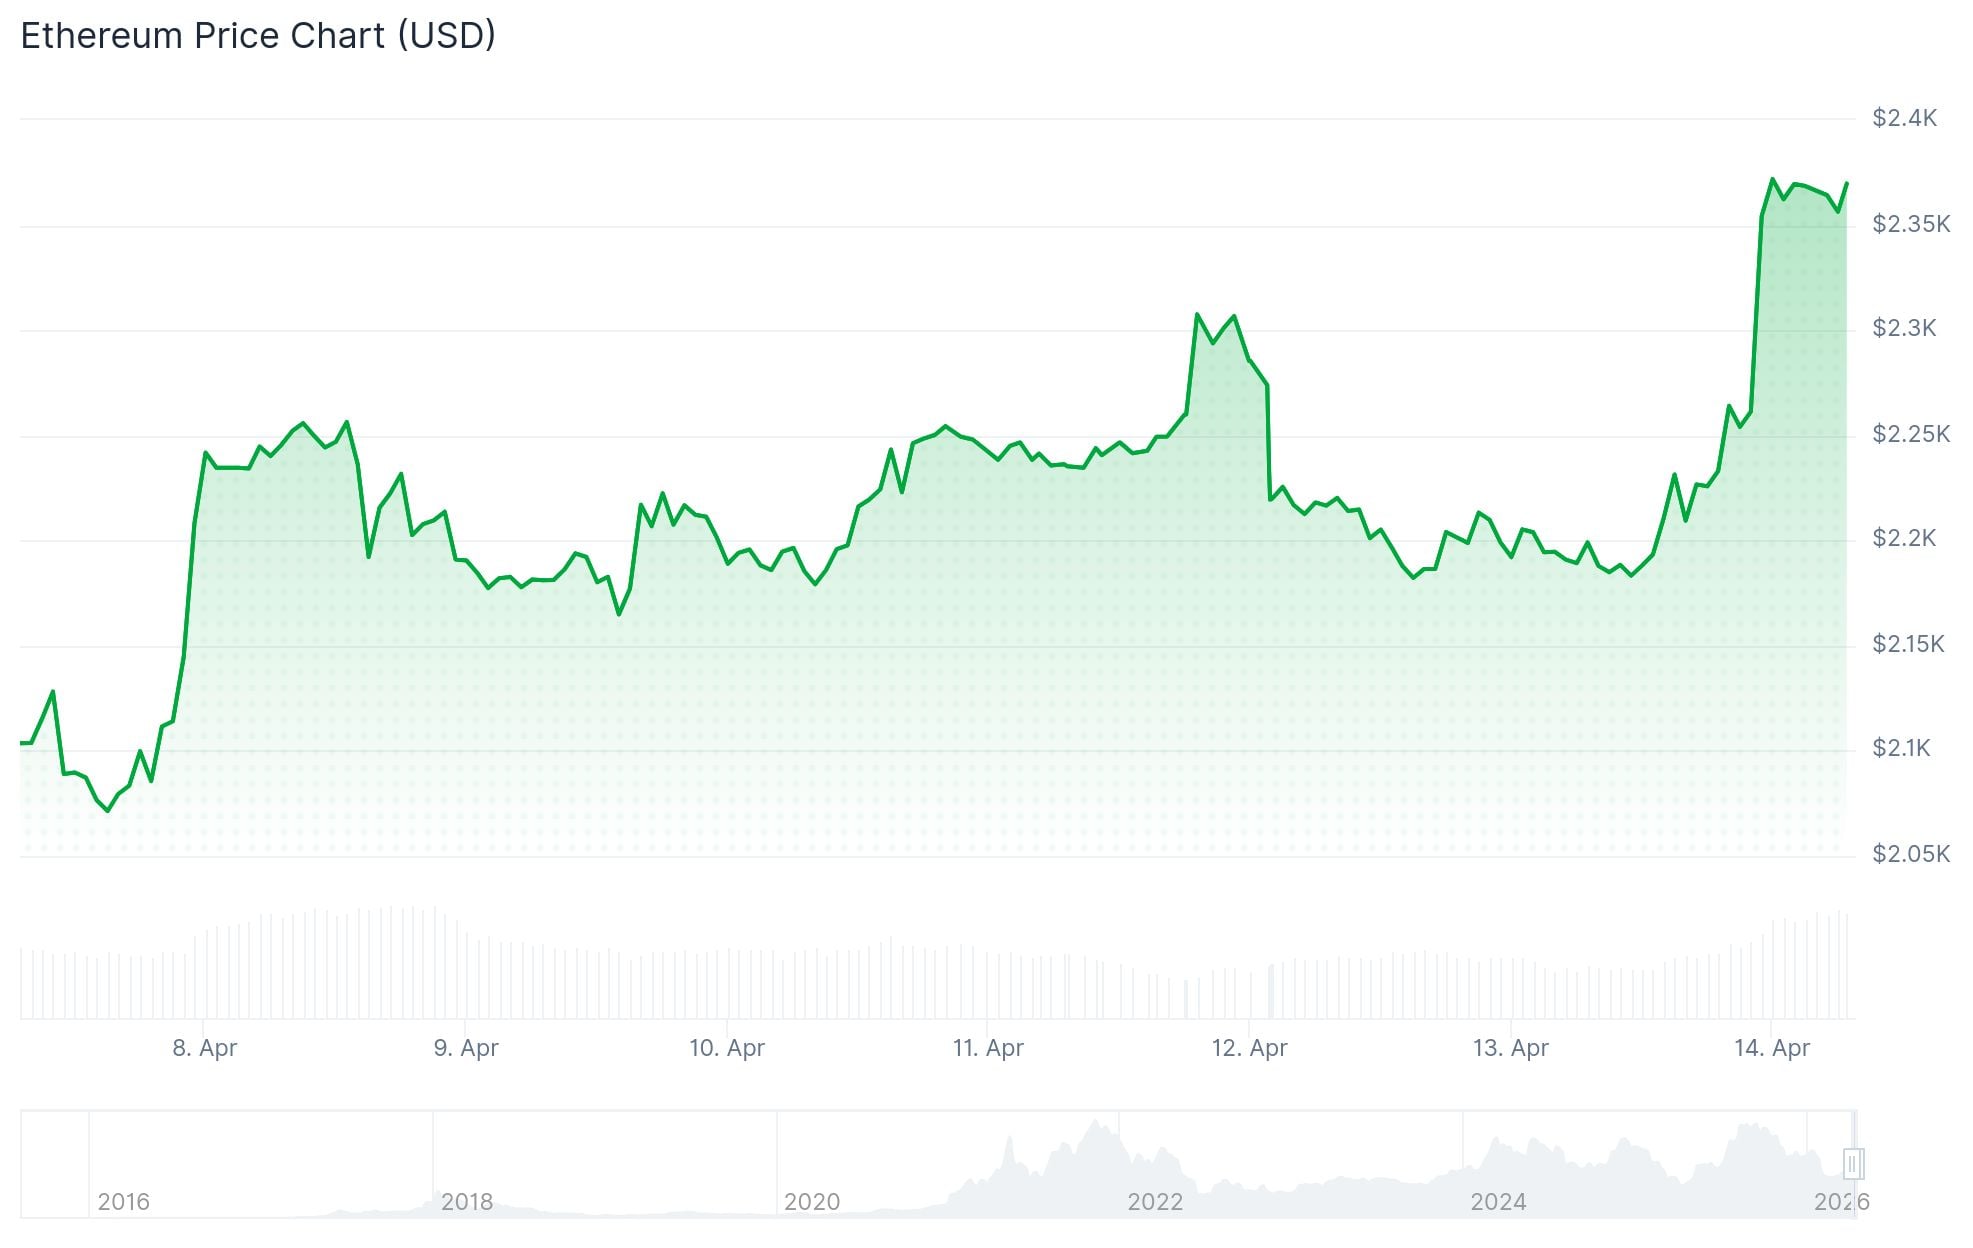
- ETH is up ~8% in 24 hours, outperforming Bitcoin’s ~5% gain
- Bitcoin ETFs saw $325.8M in net outflows on April 13; Ether ETFs recorded inflows
- Ethereum daily transactions jumped 41% week-over-week to ~3.6 million
- ETH whales are back in profit; accumulation addresses hold a record 26.3M ETH
- Key resistance sits at $2,400, with a technical target of ~$2,940
Ether has been outperforming Bitcoin over the past week as capital shifts between the two largest cryptocurrencies. ETH is up about 8% in the last 24 hours compared to Bitcoin’s roughly 5% gain, according to CoinDesk data.
The gap has widened to around 4 percentage points over the past week and nearly 9 points over the past month.
A big part of the story is ETF flows. U.S. spot Bitcoin ETFs saw $325.8 million in net outflows on April 13. Fidelity’s FBTC led those outflows with $229 million, followed by ARK’s ARKB at $63 million.
Ether ETFs moved in the opposite direction. Daily inflows came in at $7.7 million, and weekly inflows reached $187 million for the period ending April 10. That is the strongest weekly figure of 2026 and a reversal from three straight weeks of outflows. Cumulative ETH ETF inflows have now hit a record $11.68 billion.
4/13 Ethereum ETF Net Flow: +$9.44m$ETHA (BlackRock): –$4.07m$FETH (Fidelity): +$3.93m$ETHW (Bitwise): $0.00m$TETH (21Shares): –$1.35m$QETH (Invesco): $0.00m$EZET (Franklin): $0.00m$ETHV (VanEck): $0.00m$ETHB (BlackRock Staked): +$5.78m$ETHE (Grayscale): $0.00m$ETH… https://t.co/yvYANzUY4a pic.twitter.com/SRSu0X4fL8
— Trader T (@thepfund) April 14, 2026
On-chain activity on Ethereum also picked up sharply. Daily transactions rose 41% week-over-week to around 3.6 million, up from roughly 2.5 million on April 10, according to Artemis data.
Questions Around Activity Quality
Not all the data points in the same direction. Stablecoin transfer volume on Ethereum fell 42.6% over the same period, and fees dropped nearly 50%. That suggests smaller transactions and less economic value behind the activity increase.

The contrast matters. During the stablecoin surge of 2025, rising USDC and USDT volumes drove Ethereum toward record economic throughput and helped push ETH toward $4,000. The current data does not yet show that kind of activity.
Crypto analytics firm Santiment noted on X that the number of Ethereum wallets holding at least 100,000 ETH grew from 54 to 57 in one week. Santiment said there is “strong justification that the #2 market cap can continue its rise.”
🐳 The number of Ethereum wallets holding at least 100K $ETH has jumped from 54 to 57 in the past week. You can expect a level of correlation with price when this number grows, and there is strong justification that the #2 market cap can continue its rise. pic.twitter.com/bYYHoY4Y5M
— Santiment (@santimentfeed) April 13, 2026
ETH whales are also back in profit. CryptoQuant analyst CW8900 noted that wallets holding over 100,000 ETH have returned to a profitable state. According to CW8900, historically, every time whales shifted from loss to profit marked the start of a rally.
Technical Levels to Watch
ETH has formed a rounded bottom pattern on the 12-hour chart. The key neckline sits at $2,400, and a break above that level points to a measured target near $2,940.
$ETH is now back into its $2,150-$2,200 support zone.
If this level holds, Ethereum could have another rally above the $2,250 level.
Losing this zone means ETH will most likely drop towards the $2,000 level. pic.twitter.com/sSZWmNtBon
— Ted (@TedPillows) April 13, 2026
The daily RSI has climbed to 57 from near-oversold levels around 36.
Analyst TagadoBTC noted on X that Ethereum is heading toward major resistance at $2,800, and that the $2,000 zone remains critical support.
Around 7.6 million ETH is held at an average cost basis between $2,750 and $2,850, a zone where selling pressure could increase.
Total ETH held by long-term accumulation addresses reached a record 26.3 million, a 32% increase in 2026 despite a 25% price decline over the same period.


