


 Price: ETH Just Hit a 5-Year Demand Zone as Bitmine Buys the Dip")


TLDR
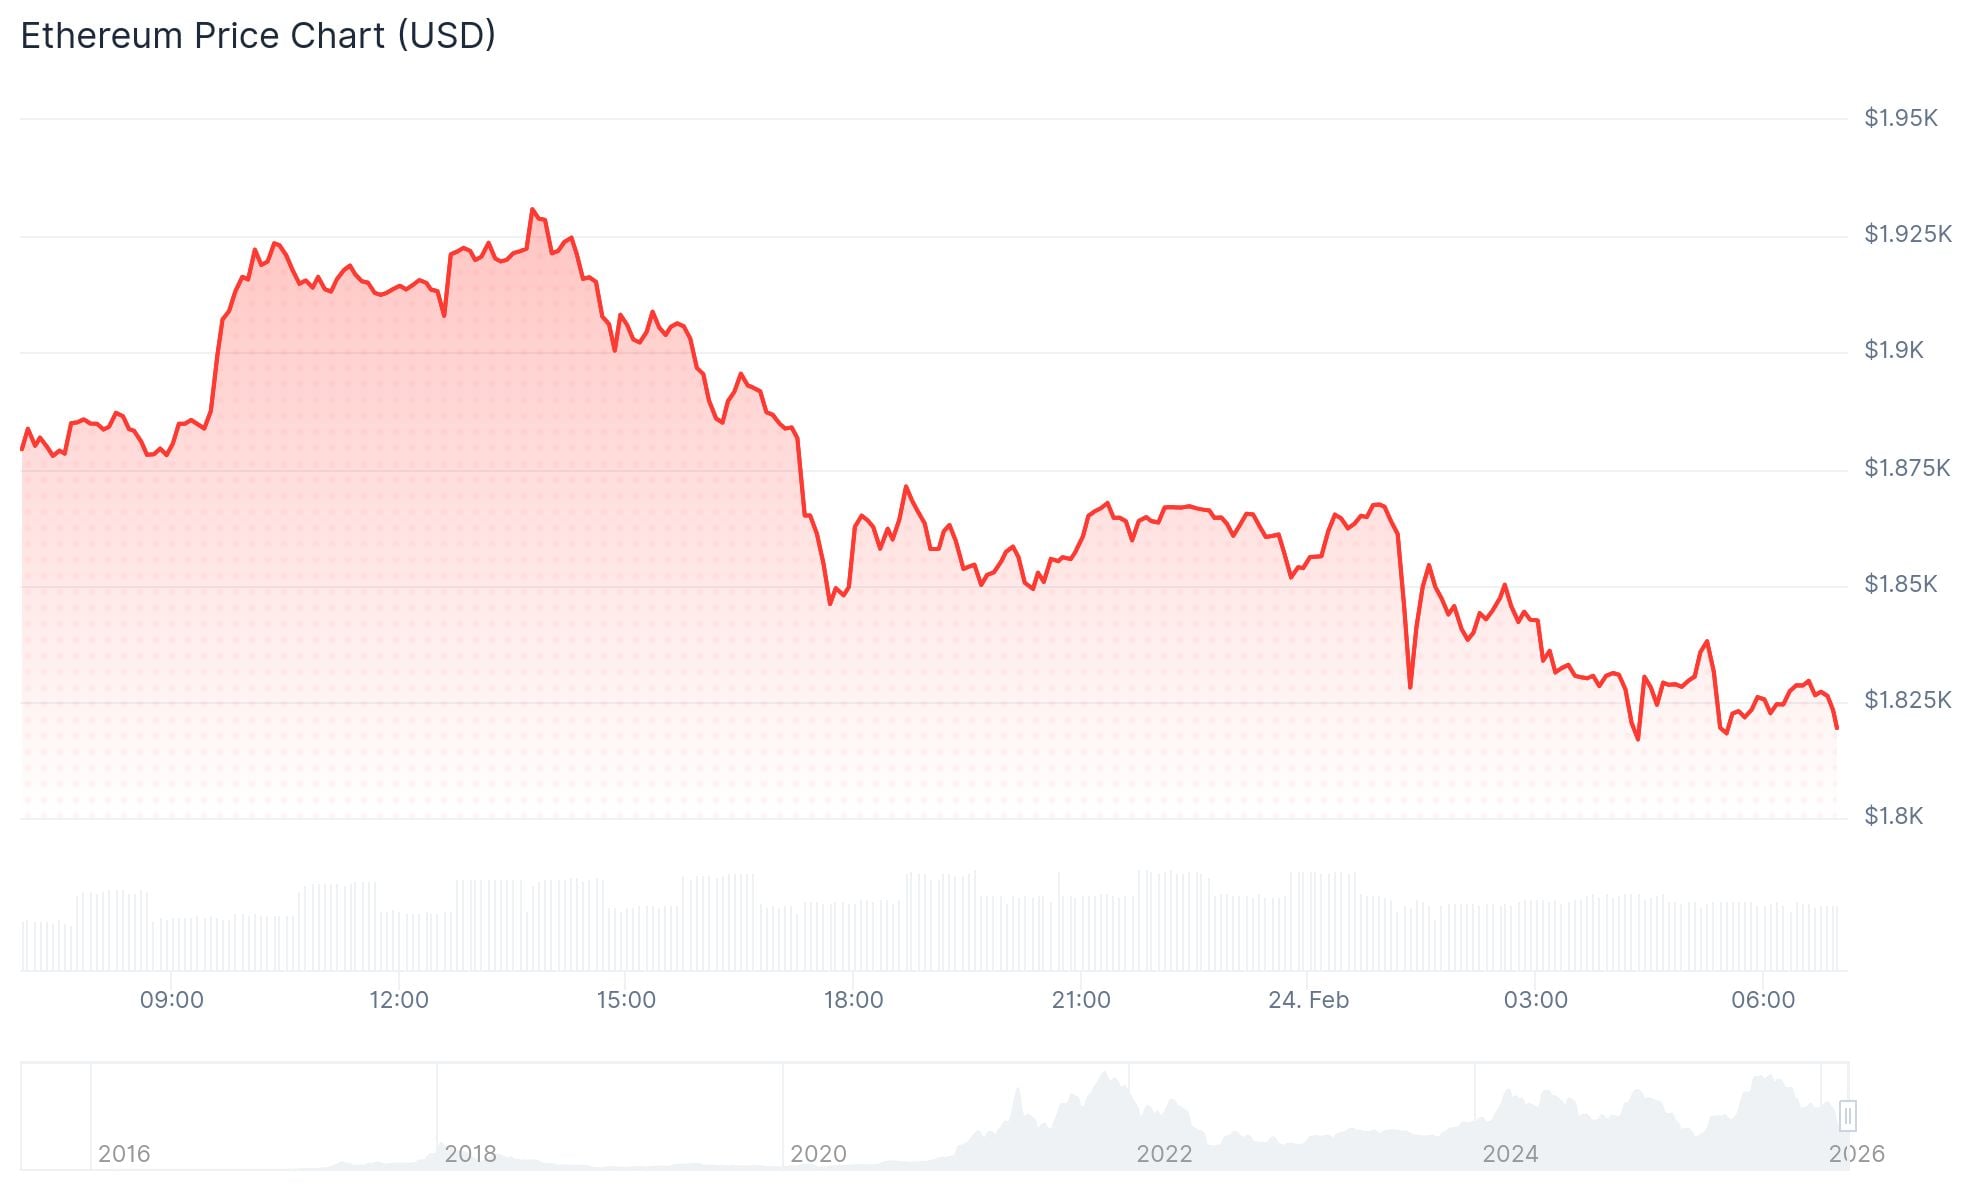
- Ethereum (ETH) is trading around $1,820, near a 5-year demand zone last seen during the 2022–2023 bear market
- Analysts have spotted a hidden bullish divergence on the weekly chart, which previously preceded a 100% rally
- Bearish market structure persists, with consecutive lower highs confirming seller control
- A breakdown below $1,820 could push ETH toward $1,740, a new yearly low
- BitMine added 51,162 ETH in one week, continuing its accumulation strategy despite the downturn
Ethereum dropped to an intraday low of $1,813 before recovering slightly to $1,820, placing it at a key technical support level that analysts are watching closely.
The price is back to levels last seen during the deep bear market of July 2022 to November 2023. Analysts describe this zone as a long-term demand area, not a distribution zone.
Analyst Merlijn The Trader said Ethereum is sitting in a 5-year demand zone. He noted that historically this range has been used for accumulation.
ETHEREUM IS SITTING AT A 5-YEAR DEMAND ZONE.
Perfect entries don’t exist.
Historically, this range
has been accumulation, not distribution.You don’t need the exact bottom.
You need exposure before expansion.Big bases don’t drift.
They reprice. pic.twitter.com/0TQ23J2Lnx— Merlijn The Trader (@MerlijnTrader) February 23, 2026
Despite that, the short-term picture remains bearish. Ethereum has formed consecutive lower highs since losing its value area high, a pattern that signals continued seller control.
The point of control (POC), a level that previously marked fair value in the trading range, has also been lost. Price has since rotated down into the value area low, adding to the bearish case.
The $1,820 level is now critical. It represents one of the last major structural supports before a deeper drop becomes likely.

Bears Eye $1,740 as Next Target
If $1,820 fails to hold, analysts say the next downside target is $1,740. That would mark a new yearly low for Ethereum.
Is $ETH about to repeat the Q4 2025 fractal again?
It looks like so. pic.twitter.com/eXcJ8SI0nx
— Ted (@TedPillows) February 22, 2026
Support levels tend to weaken after repeated tests. With bearish momentum still in play and limited buying pressure, $1,820 is under real threat.
A confirmed break below that level would open up further downside, with $1,740 being the next area where buyers may step in.
Analyst Sykodelic pointed to a hidden bullish divergence on the weekly chart. The last time this pattern appeared, ETH rallied 100%. However, that doesn’t mean a move is imminent.
Is a 100% move coming for $ETH?
Nice hidden bullish divergence printed on the Weekly chart here.
Last time this happened, $ETH rallied 100%.
For those that don't know, a hidden bullish divergence is when the RSI makes a lower lower, but price makes a higher low.
It means that… pic.twitter.com/nKgfpdrgiW
— Sykodelic 🔪 (@Sykodelic_) February 23, 2026
Investor StockTrader Max said Ethereum is no longer a short-term trade. He described it as an asset that needs a time horizon of years, not months or weeks.
Institutions Still Buying
Fundstrat’s Tom Lee runs Ethereum DAT BitMine, which added 51,162 ETH in the past week. The firm said it is focused on executing its treasury strategy and staking its holdings to generate yield.
Tom Lee acknowledged the poor price action but said crypto still has tailwinds. BitMine is continuing to buy the dip regardless.
ETH failed to hold above $1,900 earlier in the week before falling back. It briefly touched $1,813 before recovering to $1,820 at the time of writing.
The asset remains close to its February 6 low, and the technical structure has not yet shown signs of a reversal.


