


 Price Prediction: Can Bulls Finally Break Through the $4,100 Wall?")


TLDR
- Ethereum trades at $3,765.50, down 0.14% in 24 hours, just below the key $4,100 resistance level
- World Liberty Financial and SharpLink Gaming added over 150,000 ETH combined in recent purchases
- Open interest dominance climbed to 40%, the highest level since April 2023
- ETH spot ETFs recorded 17 straight days of inflows while perpetual futures volume surpassed Bitcoin
- Technical analysis shows bearish RSI divergence despite bullish momentum toward $4,500 target
Ethereum price remained steady near $3,800 on July 29, 2025, as traders watched for a potential breakout above the critical $4,100 resistance level. The second-largest cryptocurrency by market cap has struggled to maintain momentum above $4,000 since December 2024.
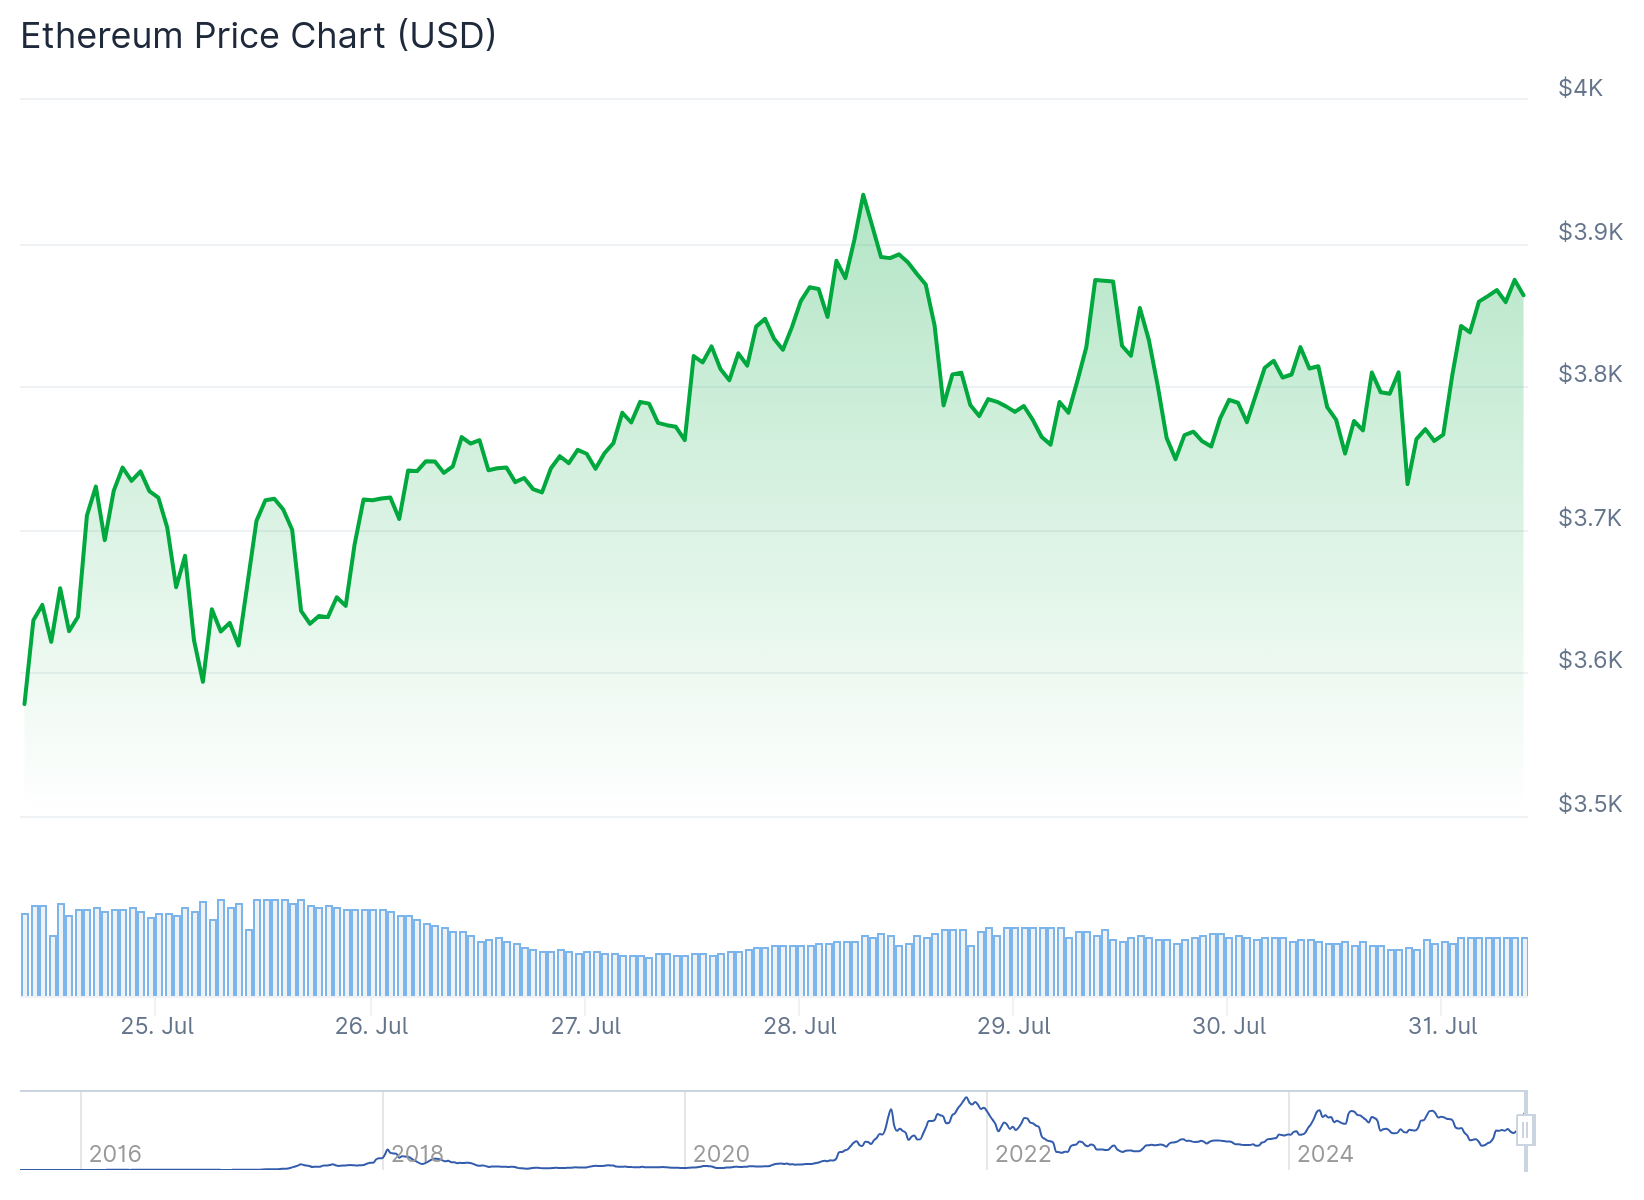
Market data shows ETH was trading at $3,765.50 at the time of reporting, representing a 0.14% decline over 24 hours. Crypto analyst Ali Martinez noted that while market excitement persists, a real move would likely require ETH to push above the $4,100 price mark.
There’s plenty of hype around Ethereum $ETH, but the real breakout begins above $4,100. pic.twitter.com/U7xBNY8oqv
— Ali (@ali_charts) July 29, 2025
World Liberty Financial made headlines with a recent purchase of 256.75 ETH for $1 million in USDC, paying an average of $3,895 per coin. The Donald Trump-linked firm has accumulated 77,226 ETH worth $296 million with an average cost of $3,294, generating an unrealized profit of approximately $41.7 million.
SharpLink Gaming also increased its Ethereum holdings by adding 77,210 ETH to its balance sheet, spending around $295 million. This purchase came weeks after the company’s earlier acquisition of nearly 80,000 ETH for $258 million.
These large-scale purchases demonstrate continued institutional interest in Ethereum despite price consolidation near current levels. The consistent buying from major holders has helped support price resilience around the $3,700-$3,800 range.
Rising Open Interest Signals Market Focus Shift
Data from Glassnode revealed that Ethereum’s open interest dominance reached almost 40%, marking the highest level since April 2023. Only 5% of trading days in history have recorded higher numbers, suggesting increased trader attention on ETH relative to Bitcoin.

#Ethereum open interest dominance has climbed to nearly 40%, its highest level since April 2023. Only 5% of days have seen a higher reading. This marks a clear shift in speculative focus, with capital rotating from $BTC to $ETH at the margin. pic.twitter.com/yNKLe9gJKt
— glassnode (@glassnode) July 29, 2025
The shift in trading focus became more apparent as Ether perpetual futures volume surpassed Bitcoin for the first time since 2022. This represents the largest recorded shift in trading focus toward ETH in recent history.
Chart analysis shows ETH open interest growing while Bitcoin’s declined, indicating traders may be positioning for Ethereum to lead the next market movement. Bitcoin dominance dropped to 61% even with BTC trading near $118,000.
ETH spot ETFs continued their positive momentum with 17 consecutive days of inflows. Scott Melker reported that institutional buying persisted despite ongoing regulatory debates in the cryptocurrency space.
Ethereum Price Prediction
Technical analysis reveals conflicting signals for Ethereum’s near-term direction. The MACD histogram registered +21.93 while the RSI-14 stood at 81.75, indicating strong demand but potential overbought conditions.

Trader Michaël van de Poppe suggested that Ethereum price remained strong and was likely to reach $4,100. He predicted a brief pullback after touching that level before attempting to move higher.
However, bearish RSI divergences appeared on both four-hour and daily timeframes. While Ethereum price printed new local highs, the relative strength index failed to confirm the move, creating bearish divergence patterns.
The divergence pattern resembles previous local tops and could signal buyer exhaustion. A persistent bearish divergence has remained unresolved since ETH crossed above $3,500, raising caution among technical analysts.
Liquidation maps show a dense cluster of short positions stacked just above $4,000. A clean break above this threshold could liquidate up to $930 million in positions, potentially fueling rapid upward movement toward $4,500.
The $4,500 level corresponds to the +1σ active realized price band, which tracks the average cost of ETH actively changing hands on the network. This metric acted as a ceiling during the March 2024 high and the 2020-21 cycle.
If bearish pressure develops, immediate support appears just below $3,700 where a narrow fair value gap exists. Deeper correction could test the long-term fair value gap between $3,200 and $3,300.
Upcoming events could influence market direction, including the Federal Reserve’s expected interest rate policy announcement. The White House is also preparing a cryptocurrency report that traders are monitoring closely.


