


 Price Prediction: Half-Billion Dollar ETF Buying Spree Fuels Recovery From Recent Dip")


TLDR
- Ethereum appears to have found a local bottom at $3,900, with technical analysis identifying a Power of 3 pattern that previously drove ETH from $2,000 to $4,900
- Spot Ethereum ETFs recorded $547 million in inflows on September 29, 2025, led by Fidelity with $202 million and BlackRock with $154 million
- The long-to-short ratio on Binance reached 1.8, while top traders showed higher conviction at 2.7, with open interest in futures near $56 billion
- Technical resistance sits at $4,275, with upside targets at $4,450, $4,800, and potentially $5,766 if momentum continues
- Daily futures volumes jumped 38% to $72 billion and options activity increased 50%, suggesting traders expect larger price swings
Ethereum traded near $4,146 at press time, down 1% over 24 hours. The price action came after ETH briefly dropped below $4,000 before recovering.
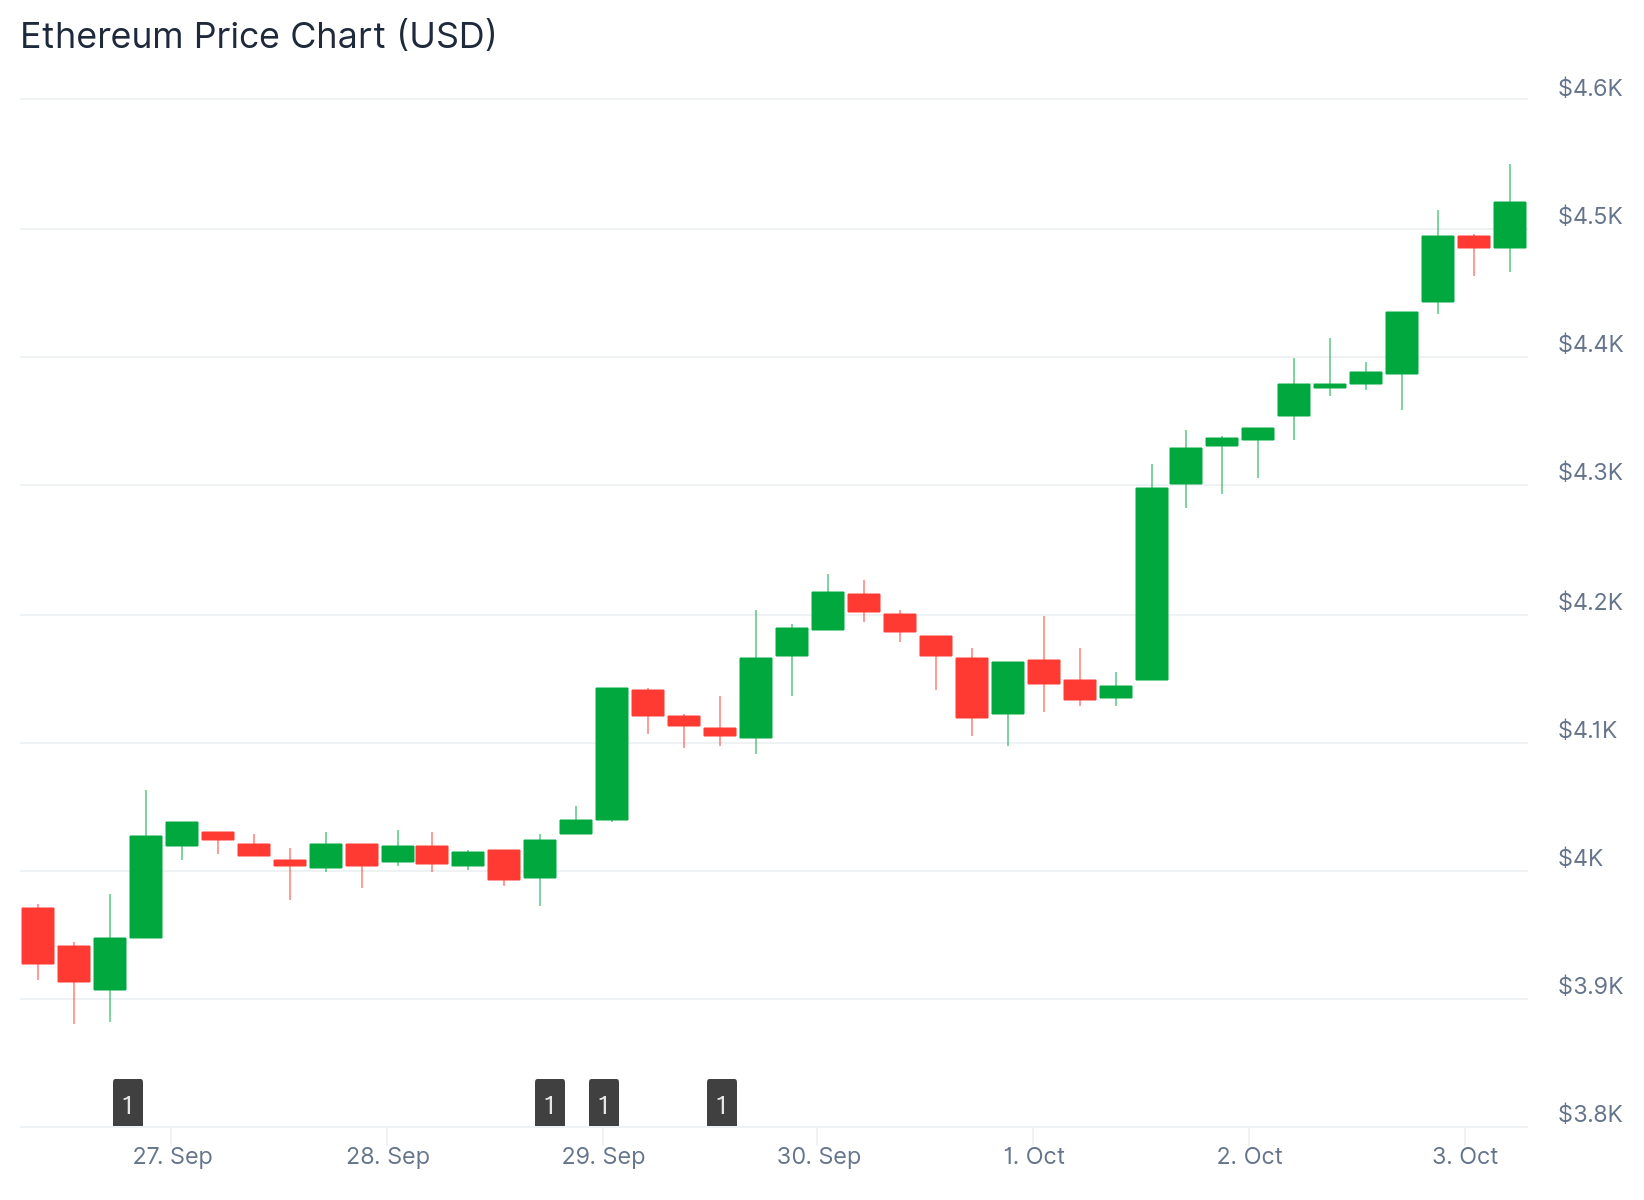
Technical analysts identified a Power of 3 pattern on the daily chart. This same setup previously drove Ethereum from $2,000 to $4,900 between May and June 2025.

The pattern consists of three phases: accumulation, manipulation, and distribution. Buyers accumulated ETH between $4,800 and $4,200 before a swift drop pushed the price below $4,000.
Market analysts interpret this move as a liquidity sweep. The retracement cleared external liquidity around $4,180 and aligned with a daily fair value gap.
The recent low below $3,900 appears to be acting as a floor price. Momentum indicators show both the 25-day and 50-day simple moving averages are acting as near-term resistance.
ETF Inflows Provide Institutional Support
Spot Ethereum ETFs attracted approximately $80 million on October 01. This ended several days of consecutive outflows.
$ETH ETF inflow of $80,900,000 🟢 yesterday.
BlackRock bought $26,200,000 in Ethereum. pic.twitter.com/MMhFO3dbHL
— Ted (@TedPillows) October 2, 2025

Research indicates that $100 million in ETF inflows can lift spot prices between 0.3% and 0.7%. This relationship suggests ETF flows play an important role in near-term price movements.
The renewed institutional demand provided a stabilizing force. Market observers noted that consistent inflows reduce downside pressure during broader market uncertainty.
Derivatives Activity Shows Bullish Positioning
Binance reported a long-to-short ratio of 1.8. Top traders displayed higher conviction with a ratio of 2.7.
Open interest in Ethereum futures remained elevated near $56 billion. Daily futures volumes climbed 38% to $72 billion.
Options activity increased by 50% during the same period. These increases suggest traders are preparing for larger price swings.
However, open interest and futures cumulative volume delta rose only marginally while price gained roughly 15% in a week. This implies the advance is not yet heavily leverage-driven.
A drop in spot cumulative volume delta during the rise indicated net aggressive sellers on spot. This bearish divergence can reflect absorption by passive buyers or distribution from larger holders.
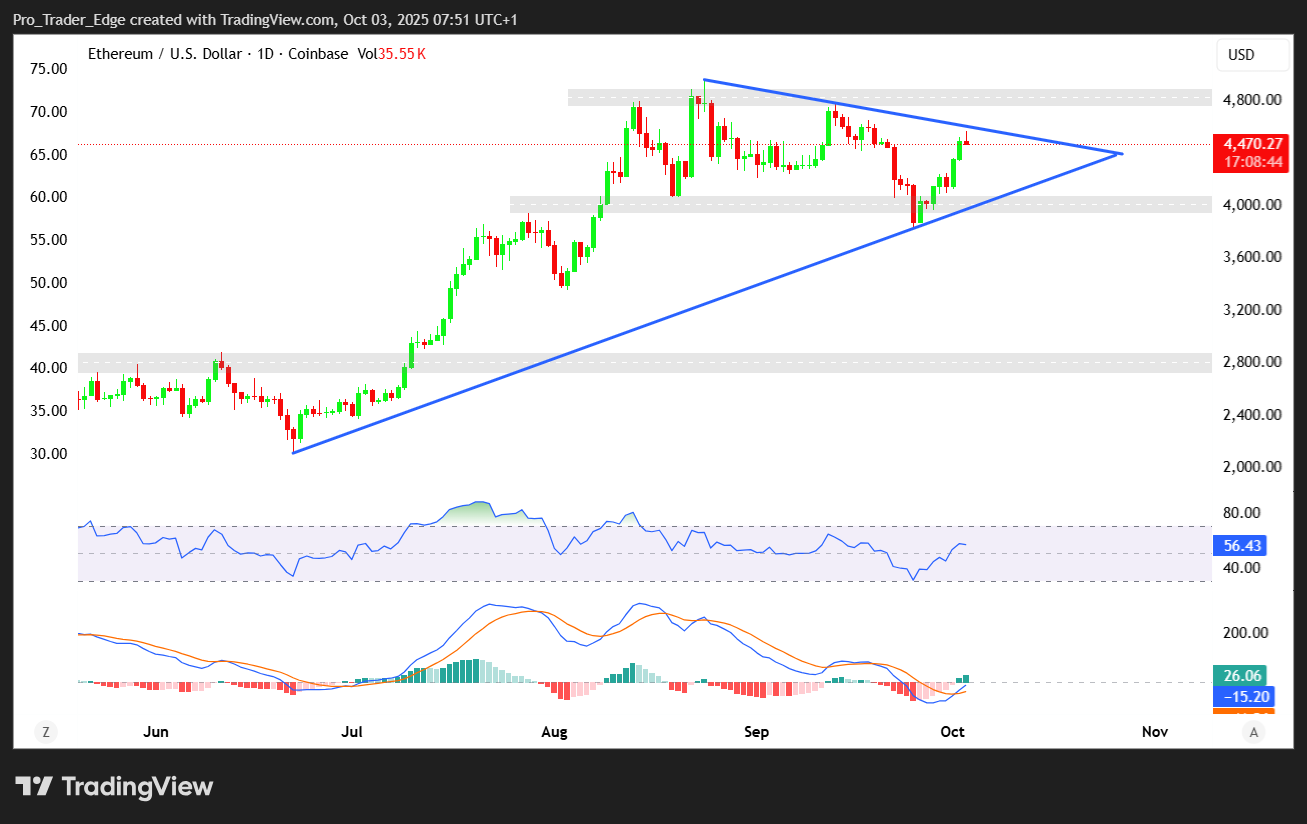
Chart analysis shows resistance near $4,275. Beyond this level, upside targets sit at $4,450 and $4,800.
Medium-term projections extend toward $5,766 if momentum sustains. Support remains between $4,100 and $4,175.
The Relative Strength Index was improving at press time. A confirmed close above $4,300 would represent a shift in structure.
Analysts expect a potential 80% to 100% breakout as the fourth quarter unfolds. This would echo the magnitude of gains seen earlier in the year.
Ethereum remains below a descending resistance trendline traced from September highs. Clearing this level is considered essential for a larger breakout.


