


 Price: Rally to $2,200 as Short Squeeze and Institutional Buying Fuel Recovery")


TLDR
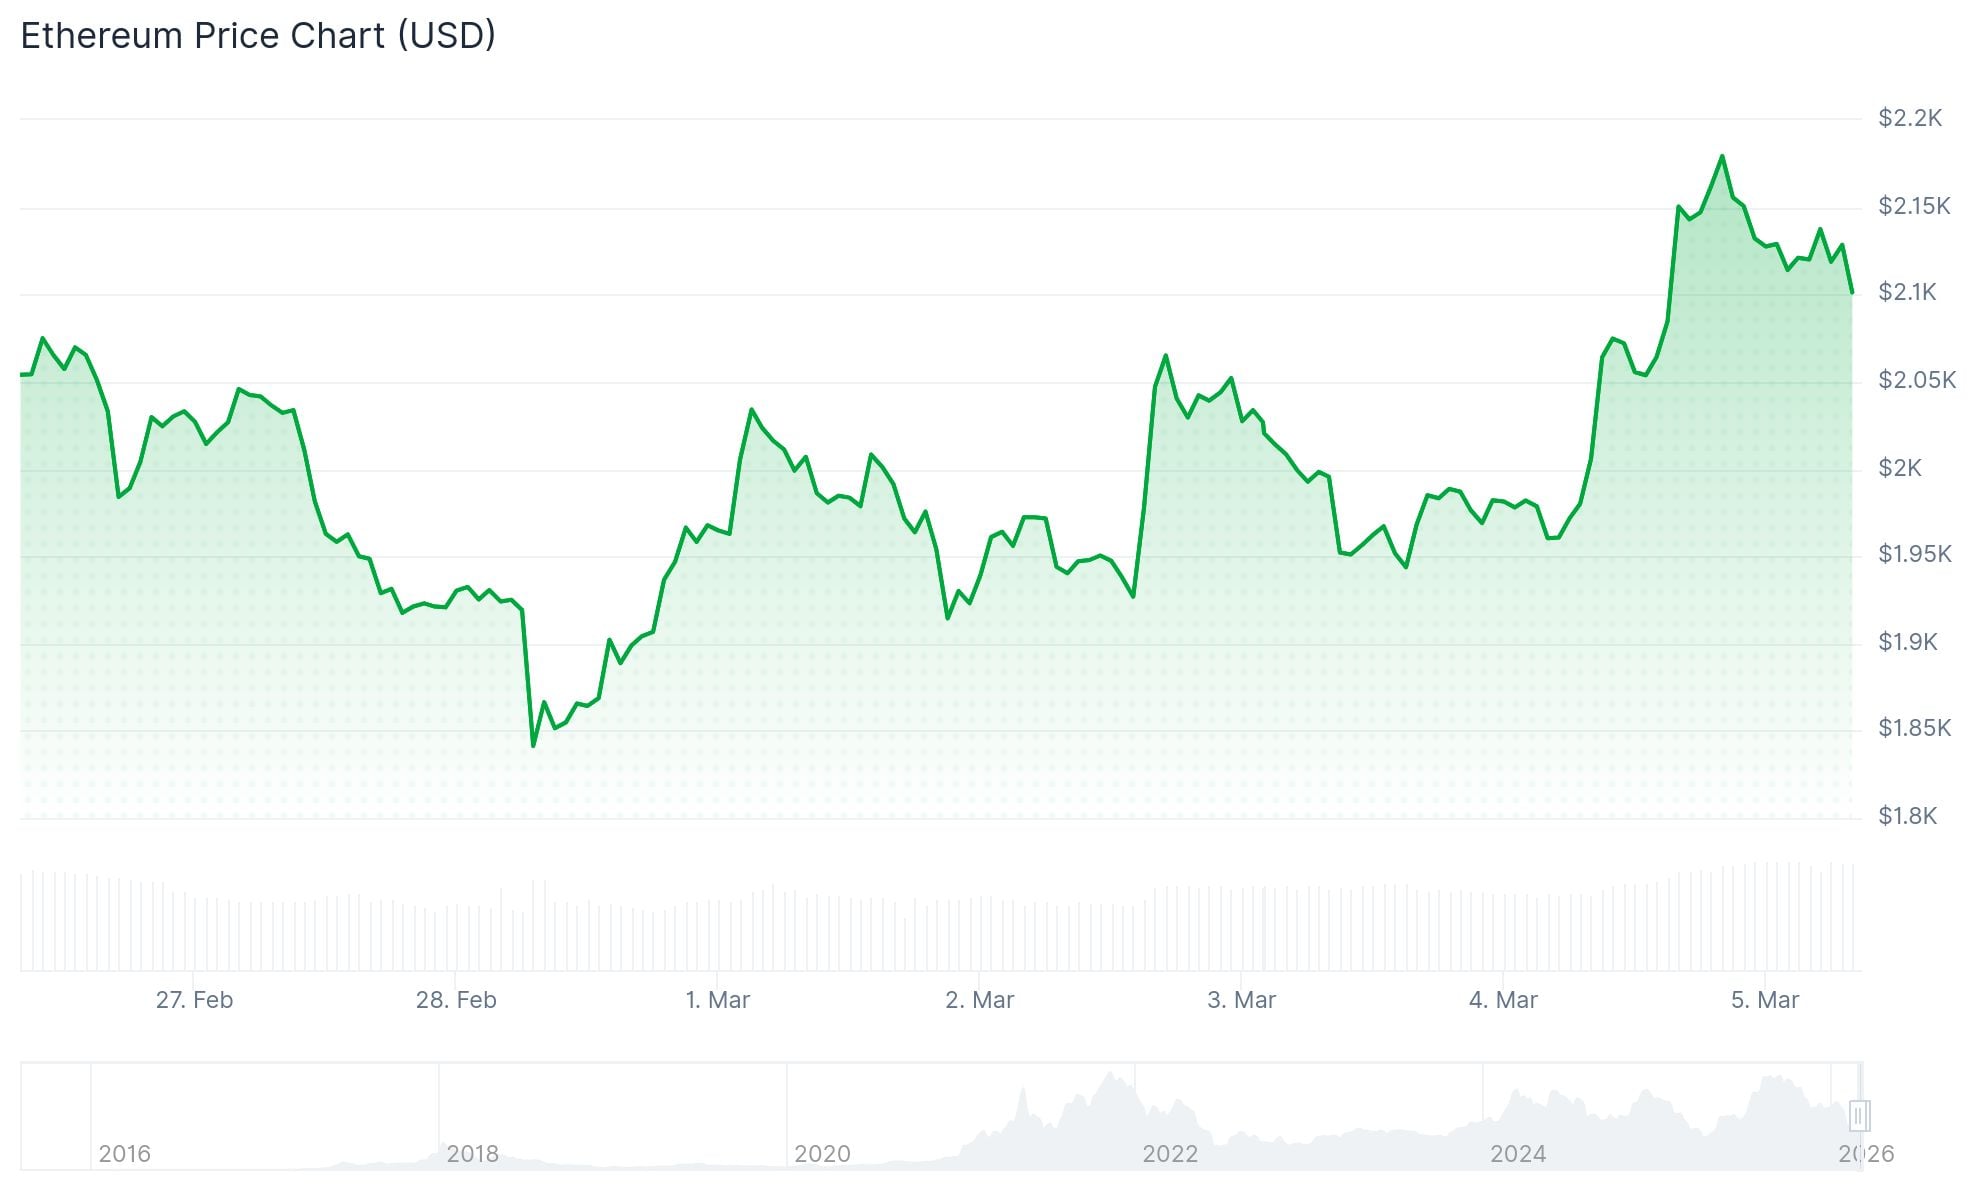
- ETH jumped above $2,100, hitting a 4-week high of $2,192 driven by a market-wide recovery
- Over $133 million in short positions were liquidated in 24 hours, triggering a short squeeze
- Spot Ethereum ETFs pulled in $169.4 million in a single day, pointing to institutional demand
- Open interest rose nearly 15% to 13.43M ETH, its highest since January 31
- Key resistance sits at $2,150–$2,200; a breakout could target $2,400 then $2,750
Ethereum (ETH) has climbed back above $2,100 this week, reaching a 4-week high of $2,192 as a broader crypto market recovery took hold.
The move was partly driven by news reports that U.S. and Iran could be moving toward negotiations, which lifted risk assets across the board.
Bitcoin led the charge, reclaiming $73,000 for the first time since early February. ETH followed, rallying over 11% in 24 hours.
Trading volumes for ETH jumped 24% during this period, accounting for roughly 12% of the token’s circulating market cap.
The rally triggered a wave of short liquidations. Over $133 million in bearish positions were wiped out in 24 hours, compared to just $21.5 million in long liquidations, according to CoinGlass data.
Short liquidations hit their highest level since February 24, reaching $430 million. Around $100 million of that was ETH-specific, pointing to a strong short squeeze dynamic.
Institutional Demand Returns
Spot Ethereum ETFs recorded $169.4 million in inflows in a single day, per data from Farside Investors. This suggests institutional buyers stepped in during the rally.

$ETH ETF inflow of $169,400,000 🟢 yesterday.
BlackRock bought $39,300,000 in Ethereum. pic.twitter.com/ZNTXHHMCAs
— Ted (@TedPillows) March 5, 2026
Open interest in ETH derivatives rose nearly 15% to 13.43M ETH — the highest reading since January 31. That figure has grown by 1.2M ETH over the past two weeks.

Funding rates remain slightly negative at the time of writing, but analysts note a shift toward positive rates could confirm a return of bullish sentiment.
Technical Levels to Watch
On the daily chart, Ethereum has formed a double bottom pattern. The neckline sits at $2,200, a key psychological resistance.
$ETH has broken above the $2,100 level.
Now, Ethereum needs a daily close above the $2,150 level for a bullish rally towards the $2,400 zone.
A failure to do so will result in a retest of the $2,000 level again. pic.twitter.com/whoneO2IBe
— Ted (@TedPillows) March 5, 2026
A confirmed breakout above $2,200 could push ETH toward $2,400, which aligns with the 38.2% Fibonacci retracement level.
The RSI sits at 53, above the neutral line, confirming improving momentum after oversold conditions in recent weeks.
The MACD lines have formed a bullish crossover, and the Aroon Up indicator came in at 92.86%, well above the bearish reading of 35.71%.
ETH’s realized price — the average on-chain cost basis across all holders — sits near $2,300. A move toward this level can trigger distribution as investors look to break even.
Immediate support is at $2,108, where price action meets the 20-day EMA. A break below there opens the door to $1,741.
ETH was trading at $2,117 at the time of writing, just 1.1% below the 23.6% Fibonacci level at $2,142.


