


 Price: September Selloff Could Set Up Massive October Breakout. Here’s Why")


TLDR
- Analysts predict ETH could fall to mid-$3,000s in September before potentially surging in October, creating a “bear trap” scenario
- Ethereum’s current price setup mirrors its 2021 breakout pattern that led to gains from $200 to $4,000
- US spot Ethereum ETFs absorbed over 286,000 ETH in one week, showing strong institutional demand
- Technical analysis shows inverse head-and-shoulders pattern supporting potential $10,000 price target
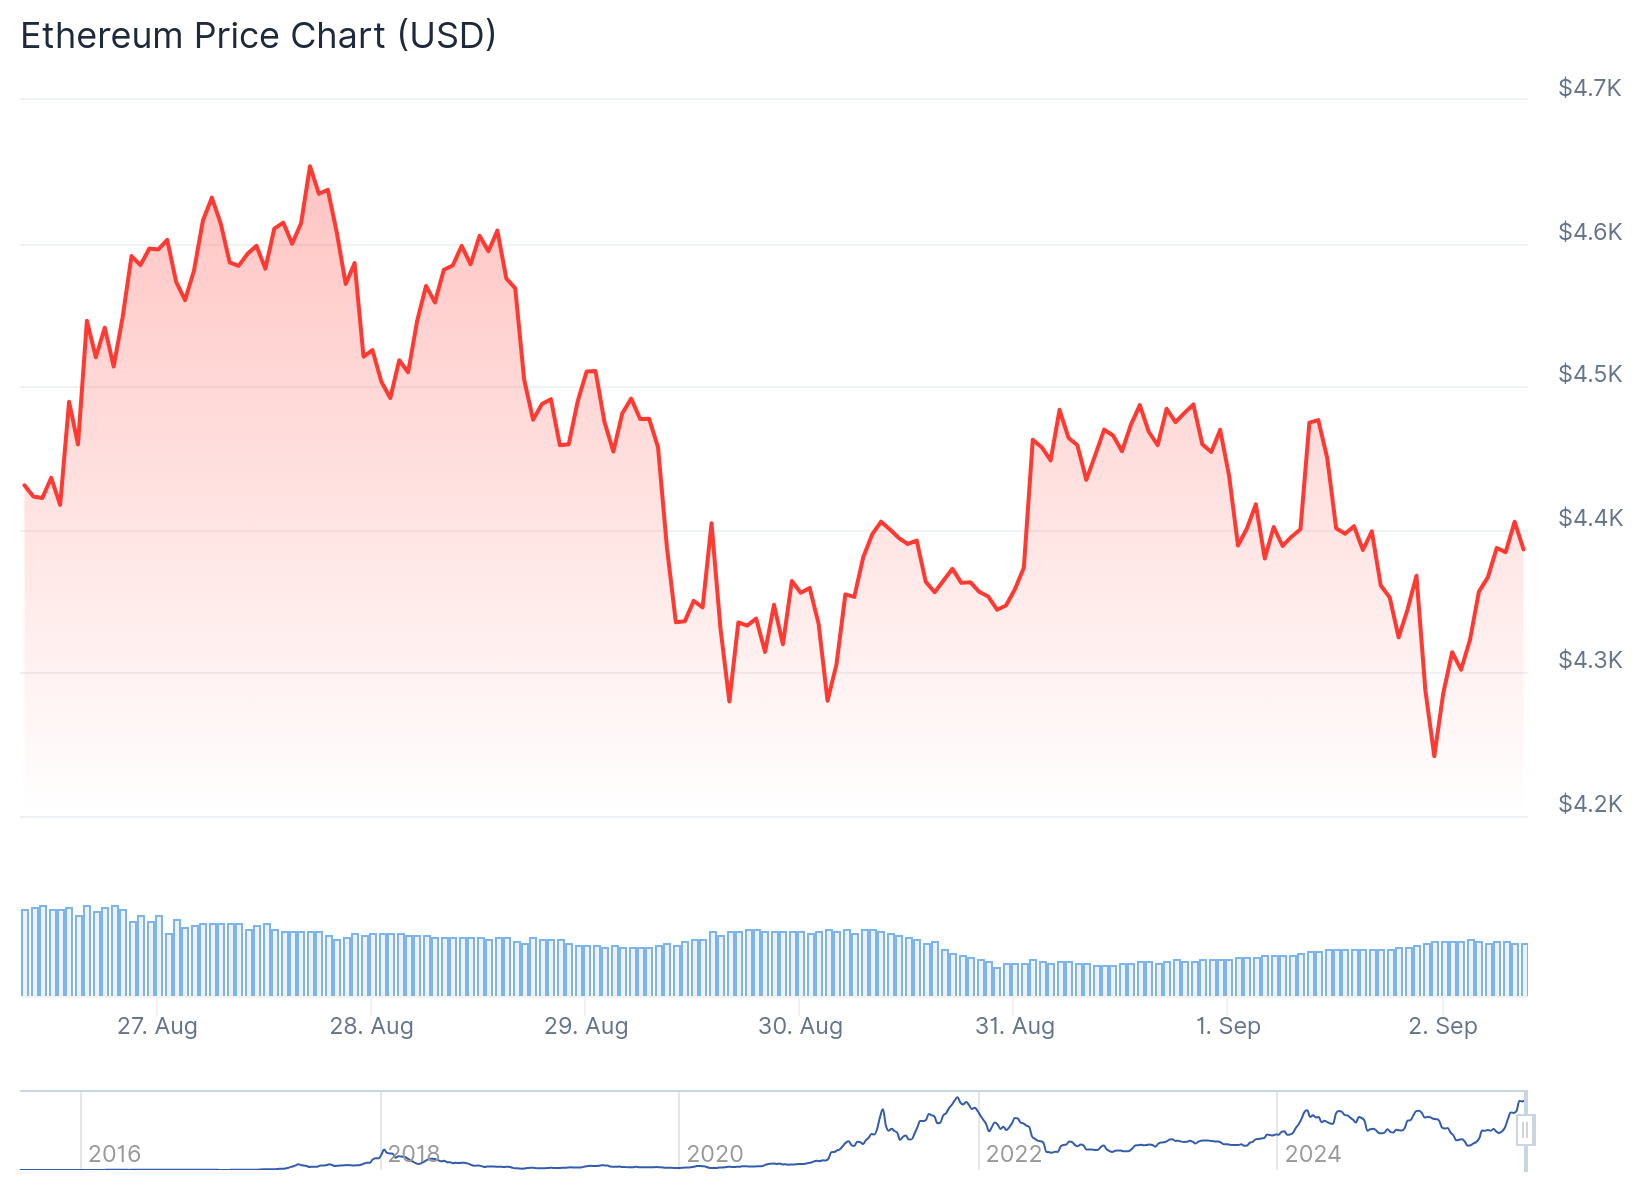
- ETH currently trades around $4,374, down 11.7% from its all-time high but showing resilience
Ethereum faces a pivotal moment as technical patterns and institutional demand create competing narratives for the cryptocurrency’s near-term direction. The world’s second-largest cryptocurrency by market cap continues to trade in a consolidation phase while analysts debate whether current conditions favor bulls or bears.
Crypto trader Johnny Woo believes Ethereum could experience what he calls “the biggest bear trap” in September. His analysis suggests ETH might fall to support levels around $3,350 before recovering sharply in October. This scenario would mirror September 2021, when ETH dropped 30% from $3,950 to $2,750 before reaching new all-time highs in November.
Here’s one possible scenario for #Ethereum $ETH #ETH:
It might look bearish at first, but if it plays out, it could be the biggest bear trap I’ve ever seen. In September, they could paint a head-and-shoulders pattern to spook everyone, then invalidate it in “Uptober,” trapping… pic.twitter.com/8aZrEJXAOx— Johnny Woo | Never DM you for Money (@j0hnnyw00) September 1, 2025
The potential head-and-shoulders pattern forming on charts could “spook everyone” before invalidating itself during what traders commonly call “Uptober.” Such a move would trap bearish traders who sold expecting further declines.
Fellow analyst Daan Crypto Trades notes that ETH has been “chopping everyone up” as it consolidates between $4,300 and $4,500. He identifies the four-hour 200 moving average around $4,160 as a key level to watch for potential retests.
$ETH Has just been chopping everyone up as it has been consolidating in the middle of the range around this $4.3K-$4.5K area.
Still not a place for me to take any trade with the lack of momentum and especially at the start of a new week & month.
I think a retest of the range… https://t.co/VwW05H1hW3 pic.twitter.com/wRC5zSYuCs
— Daan Crypto Trades (@DaanCrypto) September 1, 2025
Historical Pattern Recognition
Technical analyst Merlijn The Trader points to striking similarities between current price action and Ethereum’s 2021 breakout setup. The pattern includes a dead-cat bounce followed by months of consolidation and a final retest near $2,000. This same structure previously powered ETH from $200 to $4,000 during the last bull cycle.

ETHEREUM JUST COMPLETED THE 2021 SETUP.
Same dead cat. Same retest. Same ignition.
But this time Wall Street is inside the trade.The setup that ran $200 to $4,000 is live again.
Now? $10,000 $ETH isn’t a fantasy. It’s math. pic.twitter.com/1iBWNmyEGb
— Merlijn The Trader (@MerlijnTrader) September 1, 2025
The weekly chart displays an inverse head-and-shoulders formation, typically viewed as a bullish reversal signal. The left shoulder sits near $2,200, the head touched $1,500, and the right shoulder has formed above $3,500. However, resistance at $4,943 remains a critical barrier that must be cleared for further upside.
Current Stoch RSI readings show overbought conditions cooling, potentially opening the door for a retest of $4,100 support levels. Such a move could provide the foundation for stronger demand to resume and break Ethereum out of its multi-year consolidation pattern.
Institutional Demand Surge
US spot Ethereum ETFs recorded inflows exceeding 286,000 ETH in a single week, marking one of the largest totals since their launch. This institutional interest represents a shift from the retail-driven 2021 cycle to professional money management involvement. The consistent inflows help reduce exchange supply and create additional price stability during volatile periods.
Glassnode analytics confirm steady institutional demand continues despite recent price fluctuations. Unlike previous cycles where retail investors led market movements, institutions now provide a more stable foundation for potential price appreciation.
The ETF demand creates lasting structural changes to Ethereum’s supply dynamics. As institutions accumulate ETH through these vehicles, available supply on exchanges decreases, potentially making future sell-offs harder to sustain.
Apollo Capital’s Henrik Andersson takes a more cautious approach to technical analysis. He emphasizes focusing on fundamental factors rather than historical patterns, noting that macro events like US jobs data and Federal Reserve decisions will likely drive short-term volatility.
OKX Singapore CEO Gracie Lin echoes this sentiment, highlighting that stablecoin growth and regulatory clarity provide structural support for Ethereum regardless of monthly news cycles. She notes that Ethereum powers most institutional crypto flows, positioning it for long-term growth as these systems interconnect.
Currently, ETH trades at $4,374 after falling to an intraday low of $4,238. The cryptocurrency remains 11.7% below its all-time high, representing a shallower correction compared to previous September pullbacks. Recent 24-hour performance shows a 1% decline as the market continues its consolidation phase.


