


 Price: Short Liquidations, Funding Rates and ETF Flows Explained")


TLDR
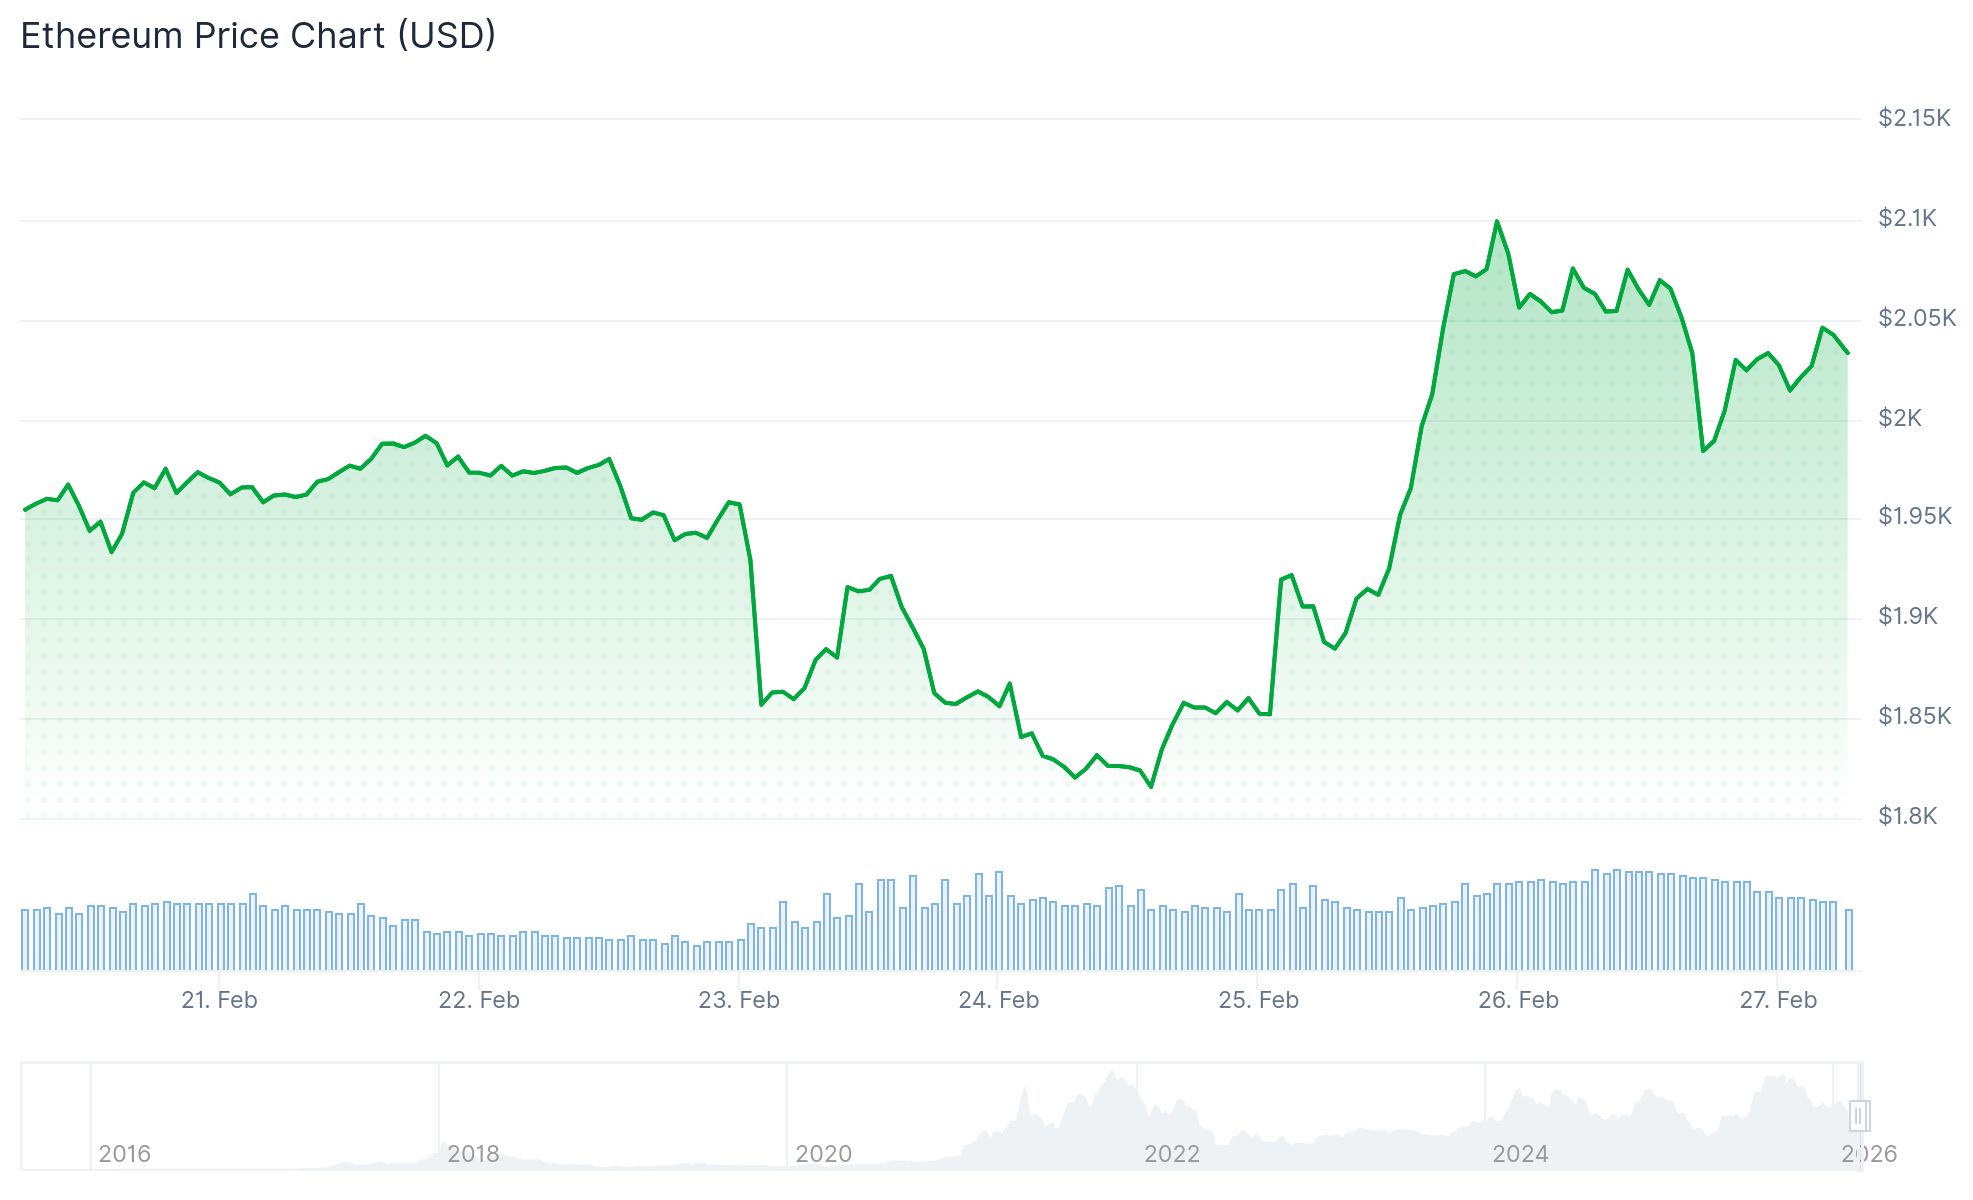
- ETH hit a weekly high of $2,150 on Thursday but faces resistance from multiple technical indicators
- A daily close above $2,100 is key, as it aligns with the cost basis of wallets holding 100,000+ ETH
- Ethereum’s 30-day realized volatility is near 0.97, its highest since March 2025
- Short positions are being liquidated, with $220M in short liquidations over two days, and funding rates turning positive
- Spot ETF selling pressure is fading, though no clear accumulation signal has emerged yet
Ethereum climbed to a weekly high of $2,150 on Thursday before pulling back. The price has been trading in a tight range, with the $2,000 level acting as a key support and $2,100 as the next major hurdle.
A daily close above $2,100 matters because that level matches the realized price of wallets holding 100,000 ETH or more. Realized price tracks the last price at which coins moved, making it a useful measure of whether large holders are in profit or at a loss.
Since 2020, ETH has traded below this whale cohort’s cost basis only a few times, most visibly during the 2022 bear market. Each time it has tested that level, the price has tended to recover.
Futures and Funding Rates
Short liquidations of over $220 million occurred over the past two days, clearing much of the overhead leverage. Funding rates on Binance, which turned sharply negative earlier this month as shorts piled in, have since swung back to a positive 0.23%.

That flip signals that late short sellers were squeezed out. However, with the funding rate now elevated, the market is tilting toward the long side, which raises the chance of a long squeeze near $1,800 if price momentum stalls.
Around $2.66 billion in long liquidation exposure sits near the $1,800 level, forming a major liquidity zone below the current price.
Volatility and ETF Flows
Ethereum’s 30-day realized volatility on Binance has surged to near 0.97, its highest reading since March 2025. Elevated volatility at this stage can reflect a market searching for a new direction rather than trending cleanly.

The price remains below the 50-, 100-, and 200-day moving averages. Each rebound since the rejection near $4,800 in late 2025 has produced lower highs, a pattern that points to continued selling pressure.
On the ETF side, selling intensity has been fading. After heavy outflows through mid-2025, recent flow data shows smaller moves in both directions. Institutional selling appears to be slowing, though a clear buying signal has not appeared yet.
Ethereum Spot ETF flows tell an interesting story right now 👇
Yes, ETH price action has been brutal. Down from ~$4,900 to under $2,000.
But look at the ETF flows closely!
🔹 After a period of heavy outflows around mid-2025, selling pressure has been gradually fading. The… pic.twitter.com/KwLvMPIfzH
— Leon Waidmann (@LeonWaidmann) February 25, 2026
Analyst Leon Waidmann noted that weak hands have largely exited the market. Short positions are also being reduced, with high-leverage longs slow to replace them.
Technical analyst IncomeSharks flagged three resistance levels, including repeat SuperTrend rejections and channel resistance near $2,250. The analyst also pointed to the April lows around $1,500 as a level to watch if buying interest fades again.
ETH was trading at $2,034 at time of writing.


