


 Price: Three Analysts Are Watching the Same Level — and It’s Not Good News")


TLDR
- ETH is trading just above $2,000, down from recent highs, with bears in control of price action.
- Two chart analysts see ETH failing at resistance and dropping toward $1,900 or lower.
- A 4-hour chart targets $1,387 if ETH breaks below $1,755.
- Trading volume spiked 150% in 24 hours to nearly $19 billion as bulls attempt to defend $2,000.
- An on-chain MVRV metric suggests a local bottom could be forming, possibly around $1,800.
Ethereum is facing pressure from multiple sides right now. Charts, on-chain data, and macro conditions are all pointing in the same direction — down.
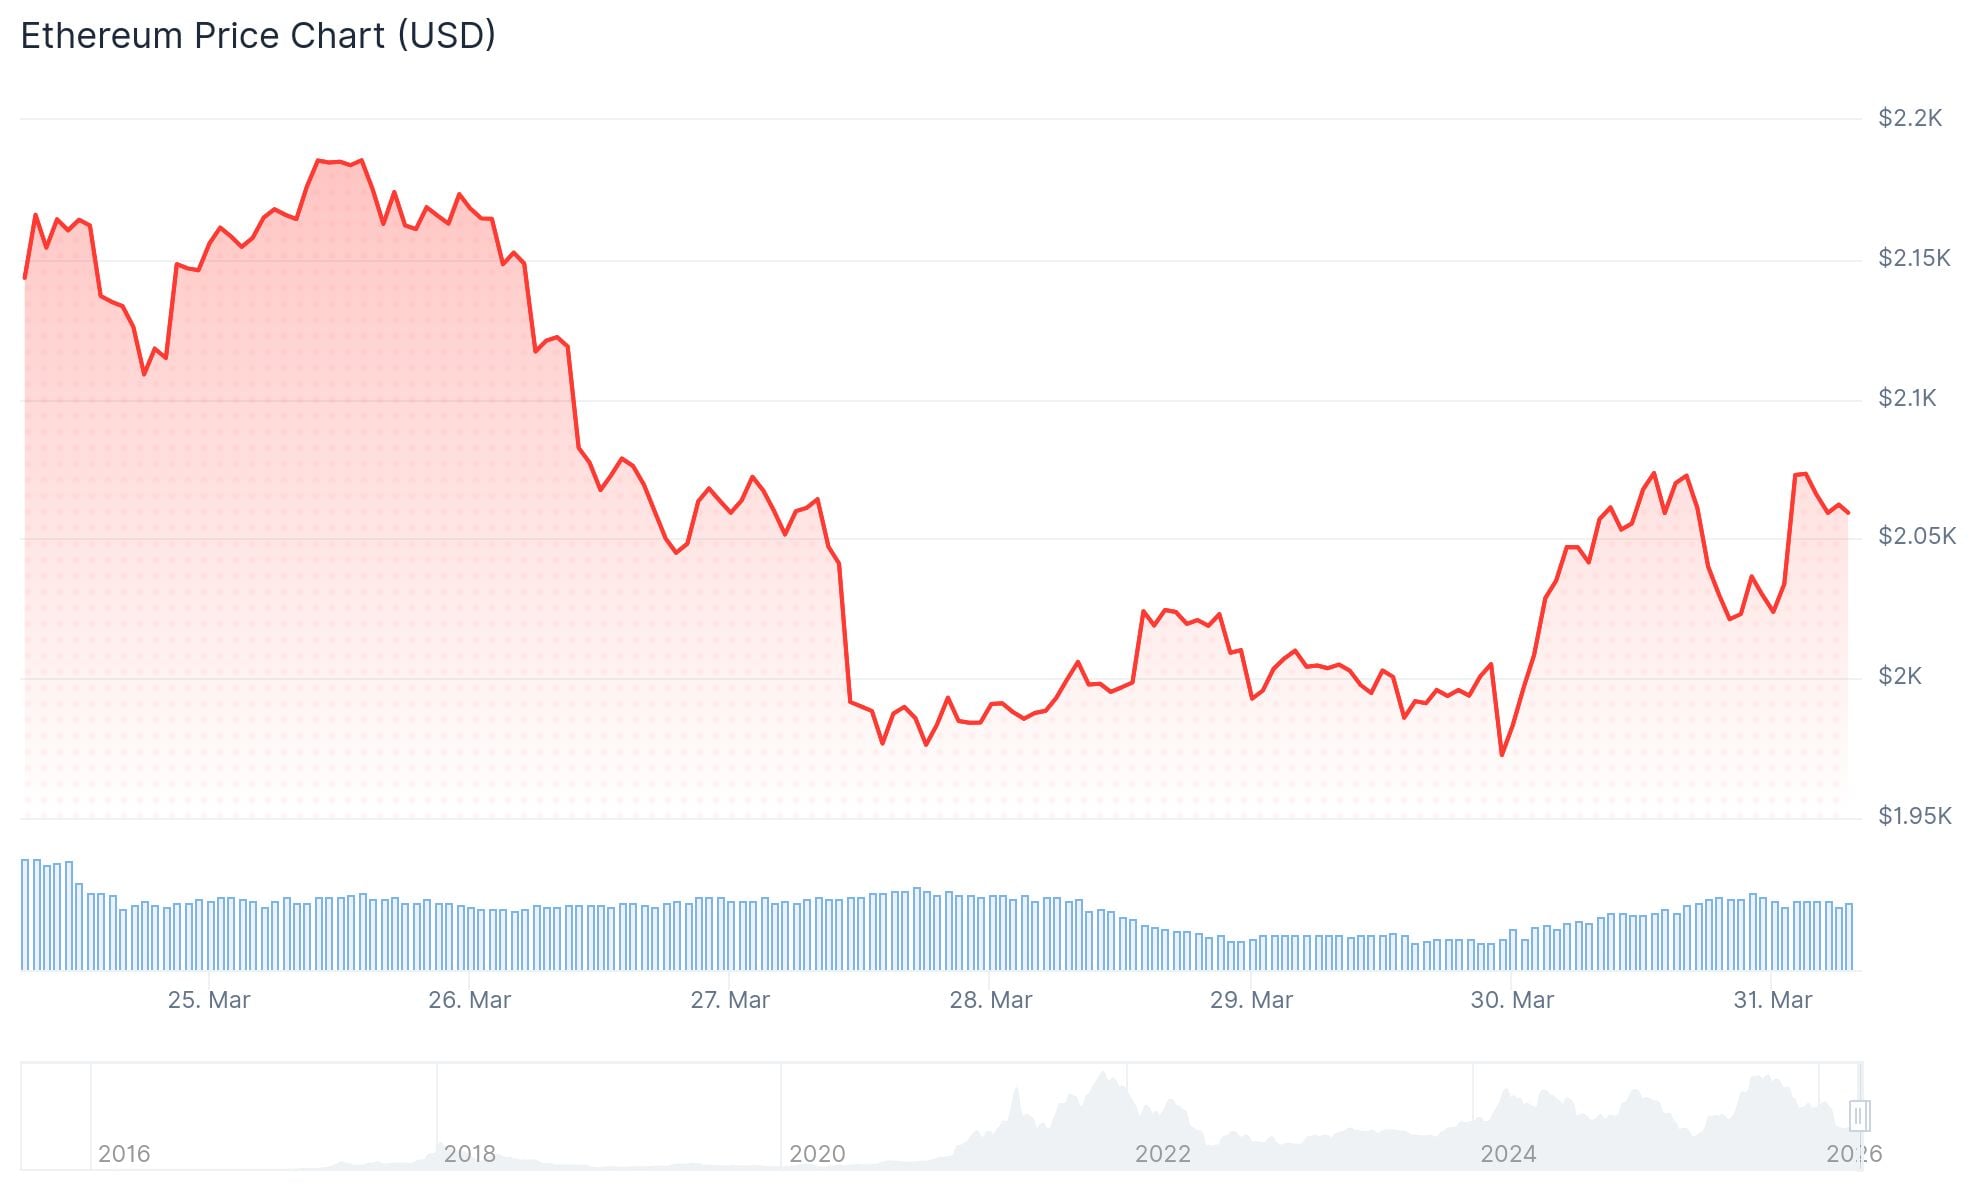
ETH is trading just above $2,000. On Sunday, it briefly dipped below that level before buyers stepped in. But the recovery has been weak. Price pulled back from a session high of $2,085 to around $2,036, and analysts say the bears still have the upper hand.
Trading volume spiked 150% in 24 hours, reaching nearly $19 billion. That accounts for roughly 9% of ETH’s circulating market cap. High volume during a bounce can be a sign of genuine buying interest, but so far it hasn’t been enough to shift the trend.
Macro conditions are adding to the pressure. Oil prices have climbed back above $100 a barrel, tied to the ongoing Iran conflict. That puts pressure on risk assets broadly, and crypto is no exception. It also raises the chance the U.S. Federal Reserve delays planned interest rate cuts, which would weigh further on speculative investments.
What the Charts Are Saying
Analyst Elja shared a 12-hour ETH chart showing a repeated pattern. ETH has bounced several times, but each recovery stayed below the broader downtrend line. His projected path shows ETH climbing toward $2,200–$2,300, hitting resistance there, then dropping back below $2,000 toward $1,900.
#Ethereum has done this before.
If this plays out like it did previously, then ETH should not break higher; instead, it should move lower. pic.twitter.com/D3WQx7vzJj
— Elja (@Eljaboom) March 30, 2026
Another analyst, Man of Bitcoin, shared a 4-hour chart with a more bearish outlook. His setup shows a clear descending trendline acting as resistance. If ETH breaks below $1,755, he sees a path toward $1,387. Elliott Wave labels on the chart suggest the market is still in a downward phase, not a completed reversal.

On X, analyst Ted Pillows posted that Ethereum has lost its RSI uptrend, adding: “Price will be next.” The Relative Strength Index has already broken below its 14-day moving average. It briefly dipped below 40, a level analysts watch as a sign that sellers are firmly in control.
$ETH has lost its RSI uptrend.
Price will be next. pic.twitter.com/L5ewU2OFDS
— Ted (@TedPillows) March 30, 2026
On-Chain Data and the $1,800 Level
One on-chain metric is getting attention: the MVRV Ratio tracked over 365 days. When this ratio dips below 0%, it means a larger share of holders are sitting at a loss. A similar pattern appeared in April 2025, just before ETH started a major rally.
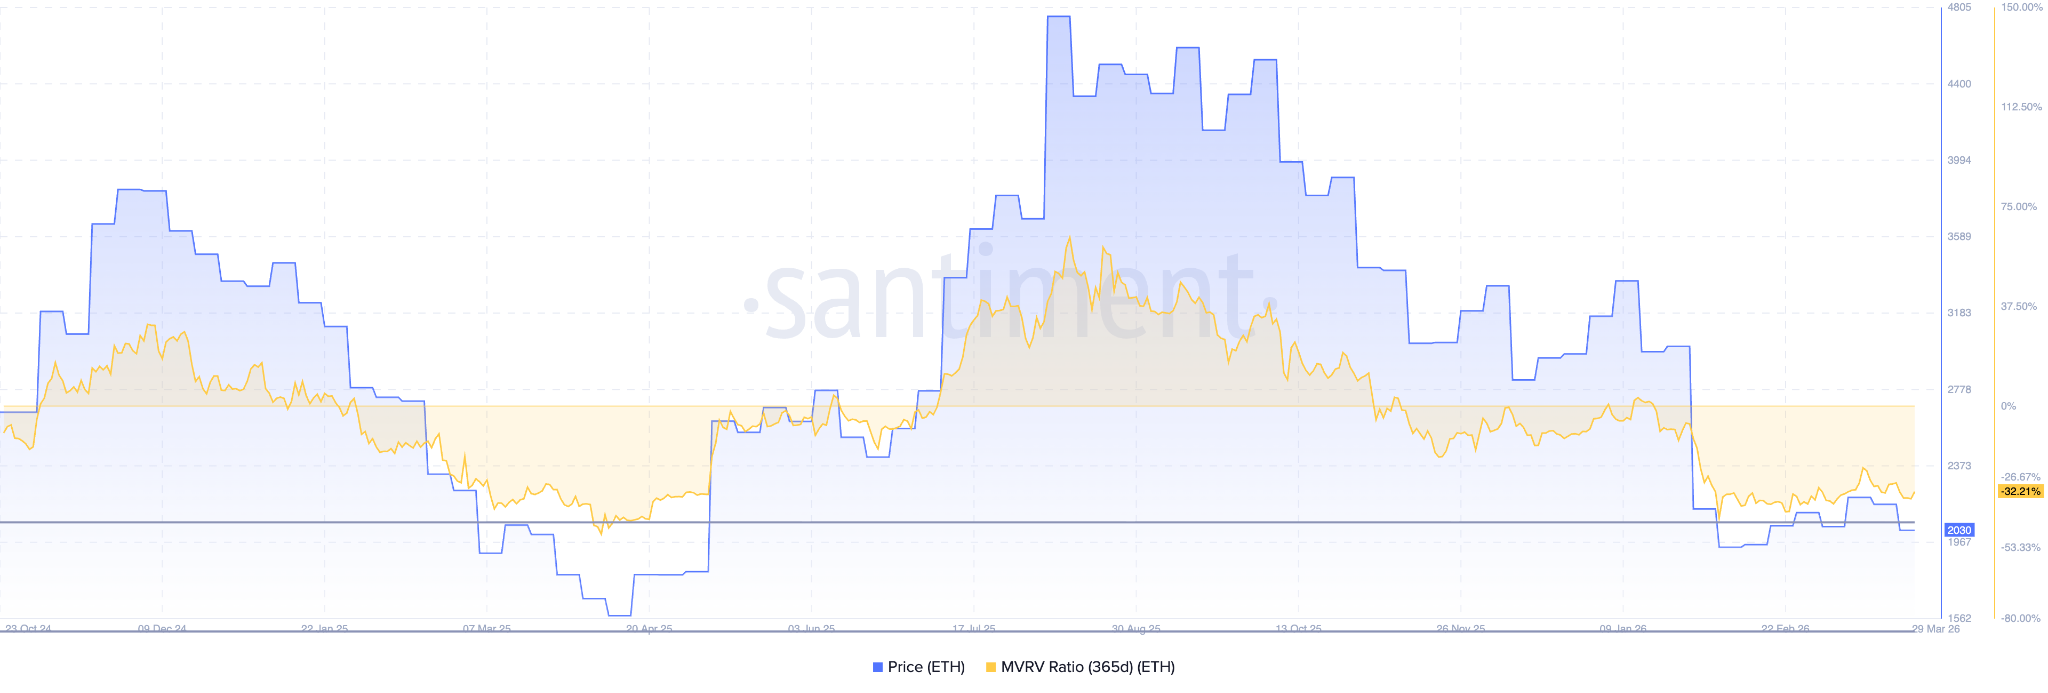
Based on the current readings, some analysts see $1,800 as the most likely floor for this cycle. A short-lived bounce to $2,150 is possible, but the broader setup still favors lower prices. The only scenario that would flip the outlook bullish is a sustained move above $2,150, which could trigger a short squeeze.
At the time of writing, ETH sits just above $2,000 with bears still in control and the next key support level at $1,800.


