


 Price: Top Analyst Projects $8,000 Target Following ‘W’ Bottom Pattern")


TLDR
- Analyst Javon Marks identifies bullish divergence on Ethereum and projects a potential move to $8,000
- John Bollinger confirms a ‘W’ bottom structure forming on ETH, suggesting a possible trend reversal
- VanEck filed for a staked Ethereum ETF that integrates Lido liquid staking protocol
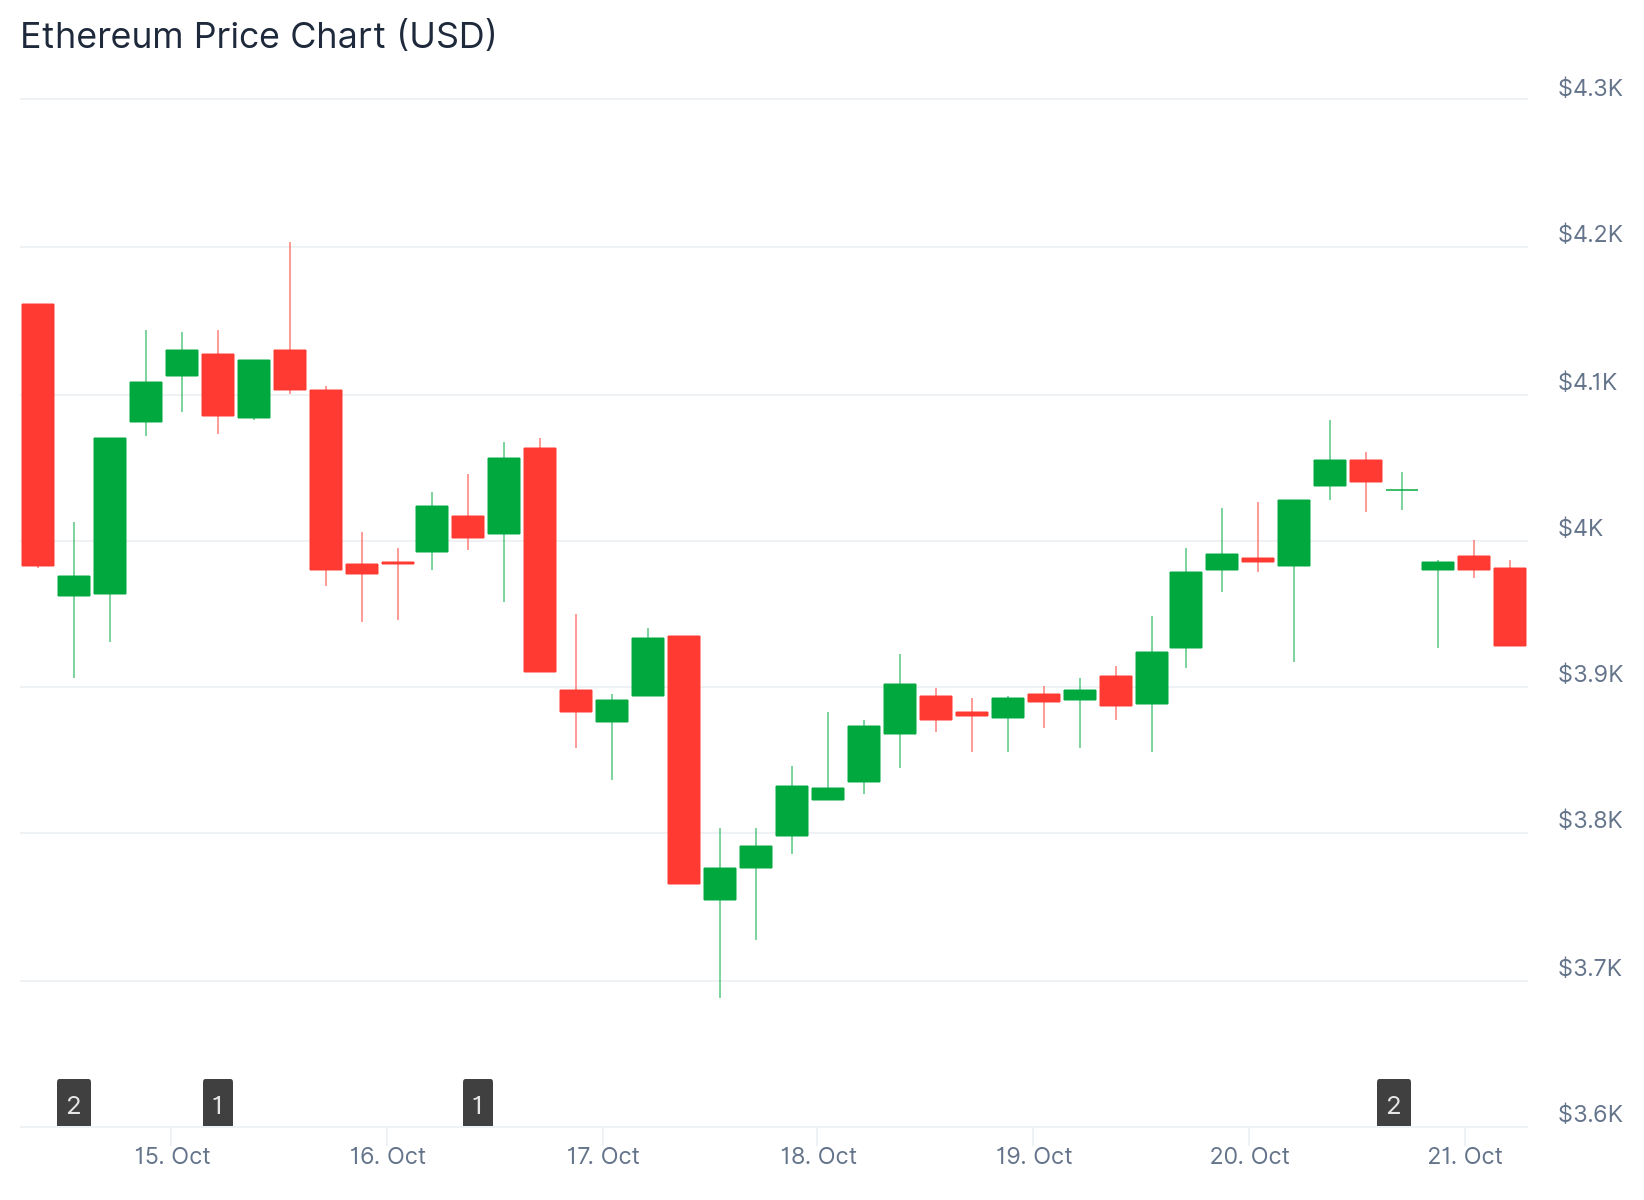
- Ethereum currently trades at $4,037 after rebounding from $3,677 support level
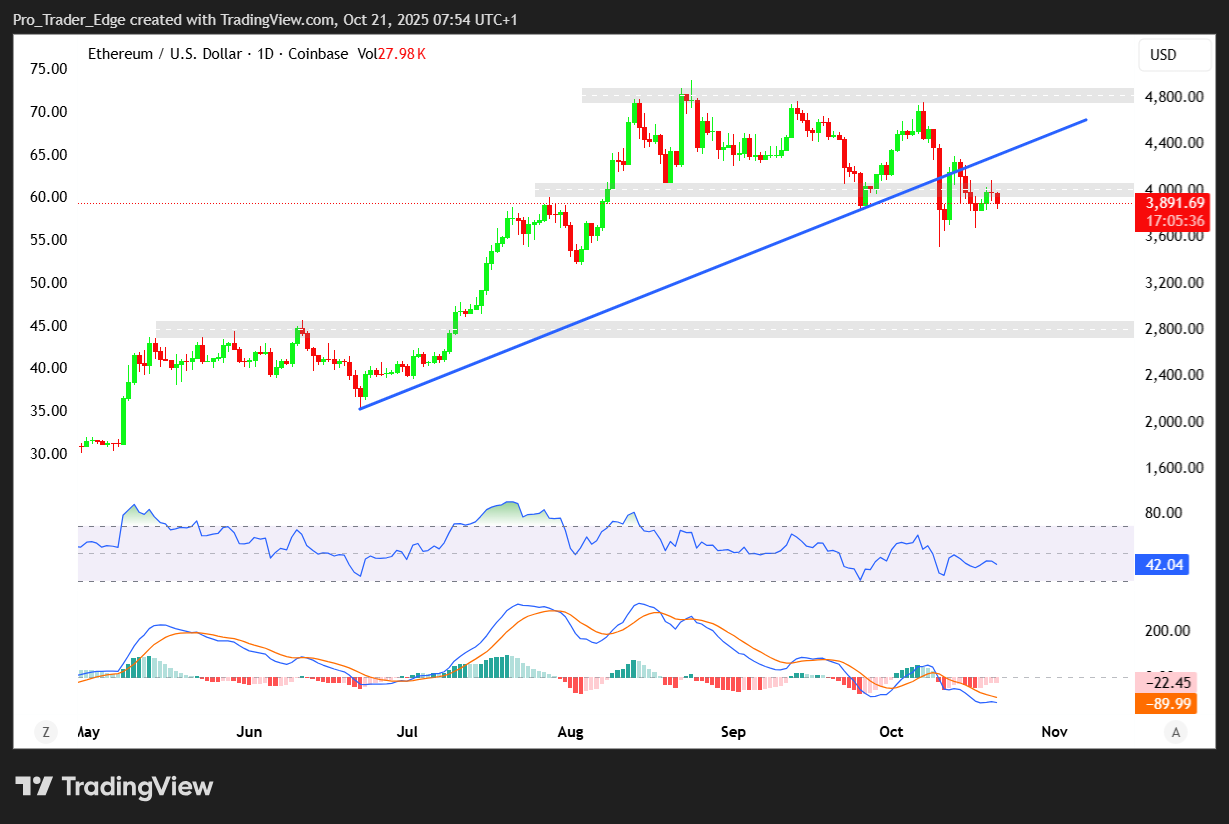
- Key resistance sits at $4,811, with support levels identified at $3,840 and $3,680
Ethereum is showing signs of recovery after an analyst projected a potential move toward $8,000. The price currently trades at $4,037 following a 1.16% daily increase.
Analyst Javon Marks recently identified a bullish divergence on the Ethereum chart. He noted that ETH could revisit the $4,700 region based on current technical patterns.
Marks highlighted $4,811 as a key resistance level. A breakout above this price point could open the path toward his projected $8,000 zone.
Clear bullish divergence set on $ETH and this is suggesting movement back into the $4,700s!
This brings prices close to a key level at the $4,811.71 point which if broken, brings $8,000+ into play…
(Ethereum) pic.twitter.com/TX7FChbqZO
— JAVON⚡️MARKS (@JavonTM1) October 19, 2025
The recovery from the previous decline has maintained support near $3,700. This level represents a healthy accumulation base where buyers continue to show interest.
On the daily chart, Ethereum rebounded from $3,444 and formed a bullish pennant flag structure. The 0.618 Fibonacci retracement at $4,255 acts as immediate resistance.
The $4,757 level remains the breakout threshold to watch. A decisive move above this region could validate the broader uptrend and target the 1.618 Fibonacci extension at $5,568.

Technical Patterns Support Bullish Outlook
John Bollinger recently noted that Ethereum displays a ‘W’ bottom structure. This pattern often links to double-dip recoveries and suggests improving resilience.
Potential 'W' bottoms in Bollinger Band terms in $ETHUSD and $SOLUSD, but not in $BTCUSD. Gonna be time to pay attention soon I think.
— John Bollinger (@bbands) October 18, 2025
The formation shows a higher second low, which indicates accumulation within the Bollinger Bands. Bollinger distinguished Ethereum and Solana from Bitcoin, which currently lacks the same structural confirmation.
VanEck filed for a staked Ethereum ETF that brings an institutional dimension to the market. The filing underscores growing regulatory engagement with Ethereum’s staking ecosystem.
The proposed ETF integrates liquid staking exposure through Lido. This protocol is already central to ETH’s yield market and manages substantial staked assets.
The combination of technical validation and regulatory progress reinforces Ethereum’s current framework. Both elements contribute to renewed market confidence.
Short-Term Price Action and Key Levels
Ethereum recently faced rejection near the $4,050 resistance zone. The price declined below $4,000 after failing to settle above key Fibonacci levels.
There was a break below a bullish trend line with support at $3,960 on the hourly chart. The price now trades below the 100-hourly Simple Moving Average.
On the upside, the price could face resistance near $3,980. The next key resistance is near $4,050, with the first major resistance at $4,080.
If Ethereum fails to clear $3,980 resistance, it could start a fresh decline. Initial support on the downside is near $3,860, with the first major support at $3,840.
A clear move below $3,840 might push the price toward $3,820 support. Further losses could send the price toward the $3,680 region.
The hourly MACD is gaining momentum in the bearish zone. The RSI for ETH/USD is now below the 50 zone, indicating short-term weakness.
VanEck’s staked Ethereum ETF filing was submitted recently and includes integration with Lido’s liquid staking protocol. The filing represents growing institutional interest in Ethereum’s staking infrastructure.


