


 Price: Traders Are Piling Back In — Here’s Why $3,000 Is on the Table")


TLDR
- ETH/BTC has fallen ~5.5% over the past week, with a bear flag pattern pointing to a possible further 10% drop to 0.026 BTC.
- Ethereum’s staking ratio hit a record 32.33%, locking up ~39 million ETH and reducing available supply.
- ETH ETFs recorded nearly $494 million in net inflows over 8 consecutive days.
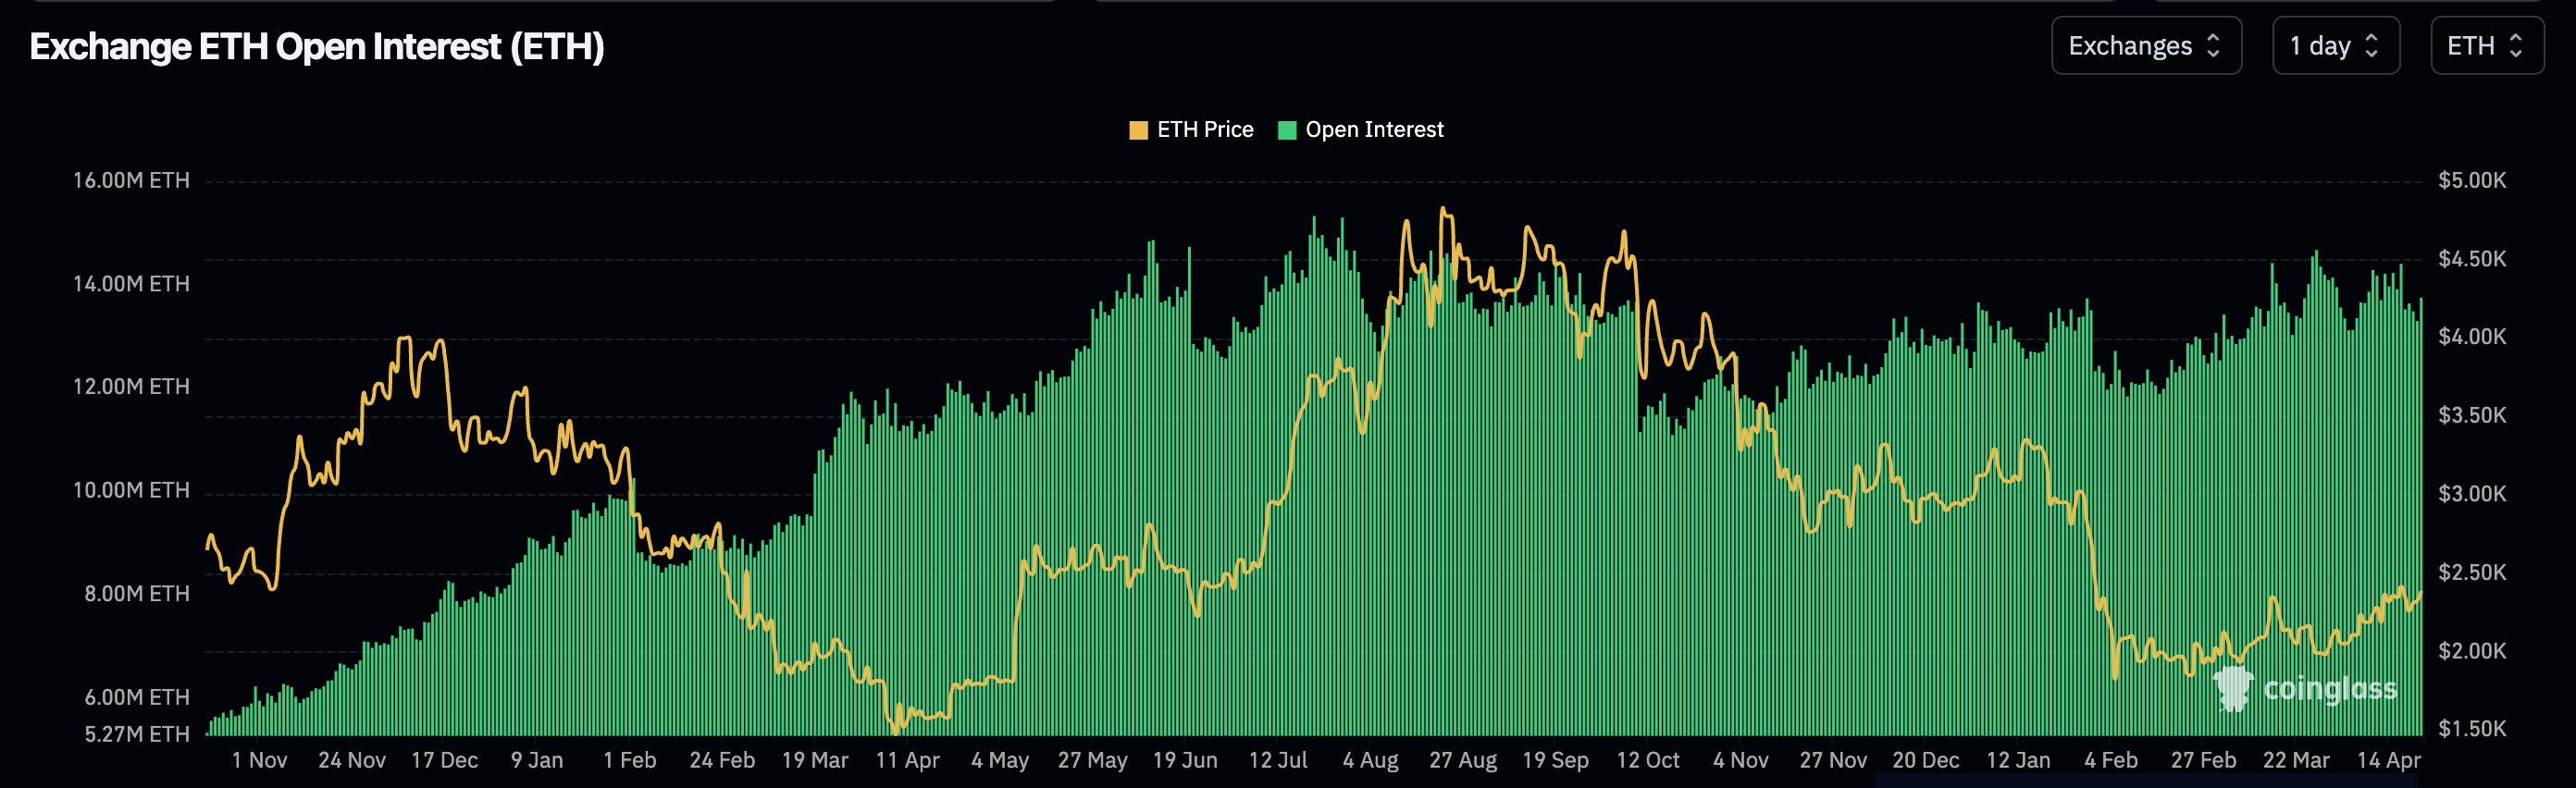
- Derivatives data turned bullish — funding rates flipped positive and open interest rose by 440K ETH.
- Short-term price targets sit at $2,746–$2,800, with $3,000 possible if ETH clears the 200-day EMA at $2,650.
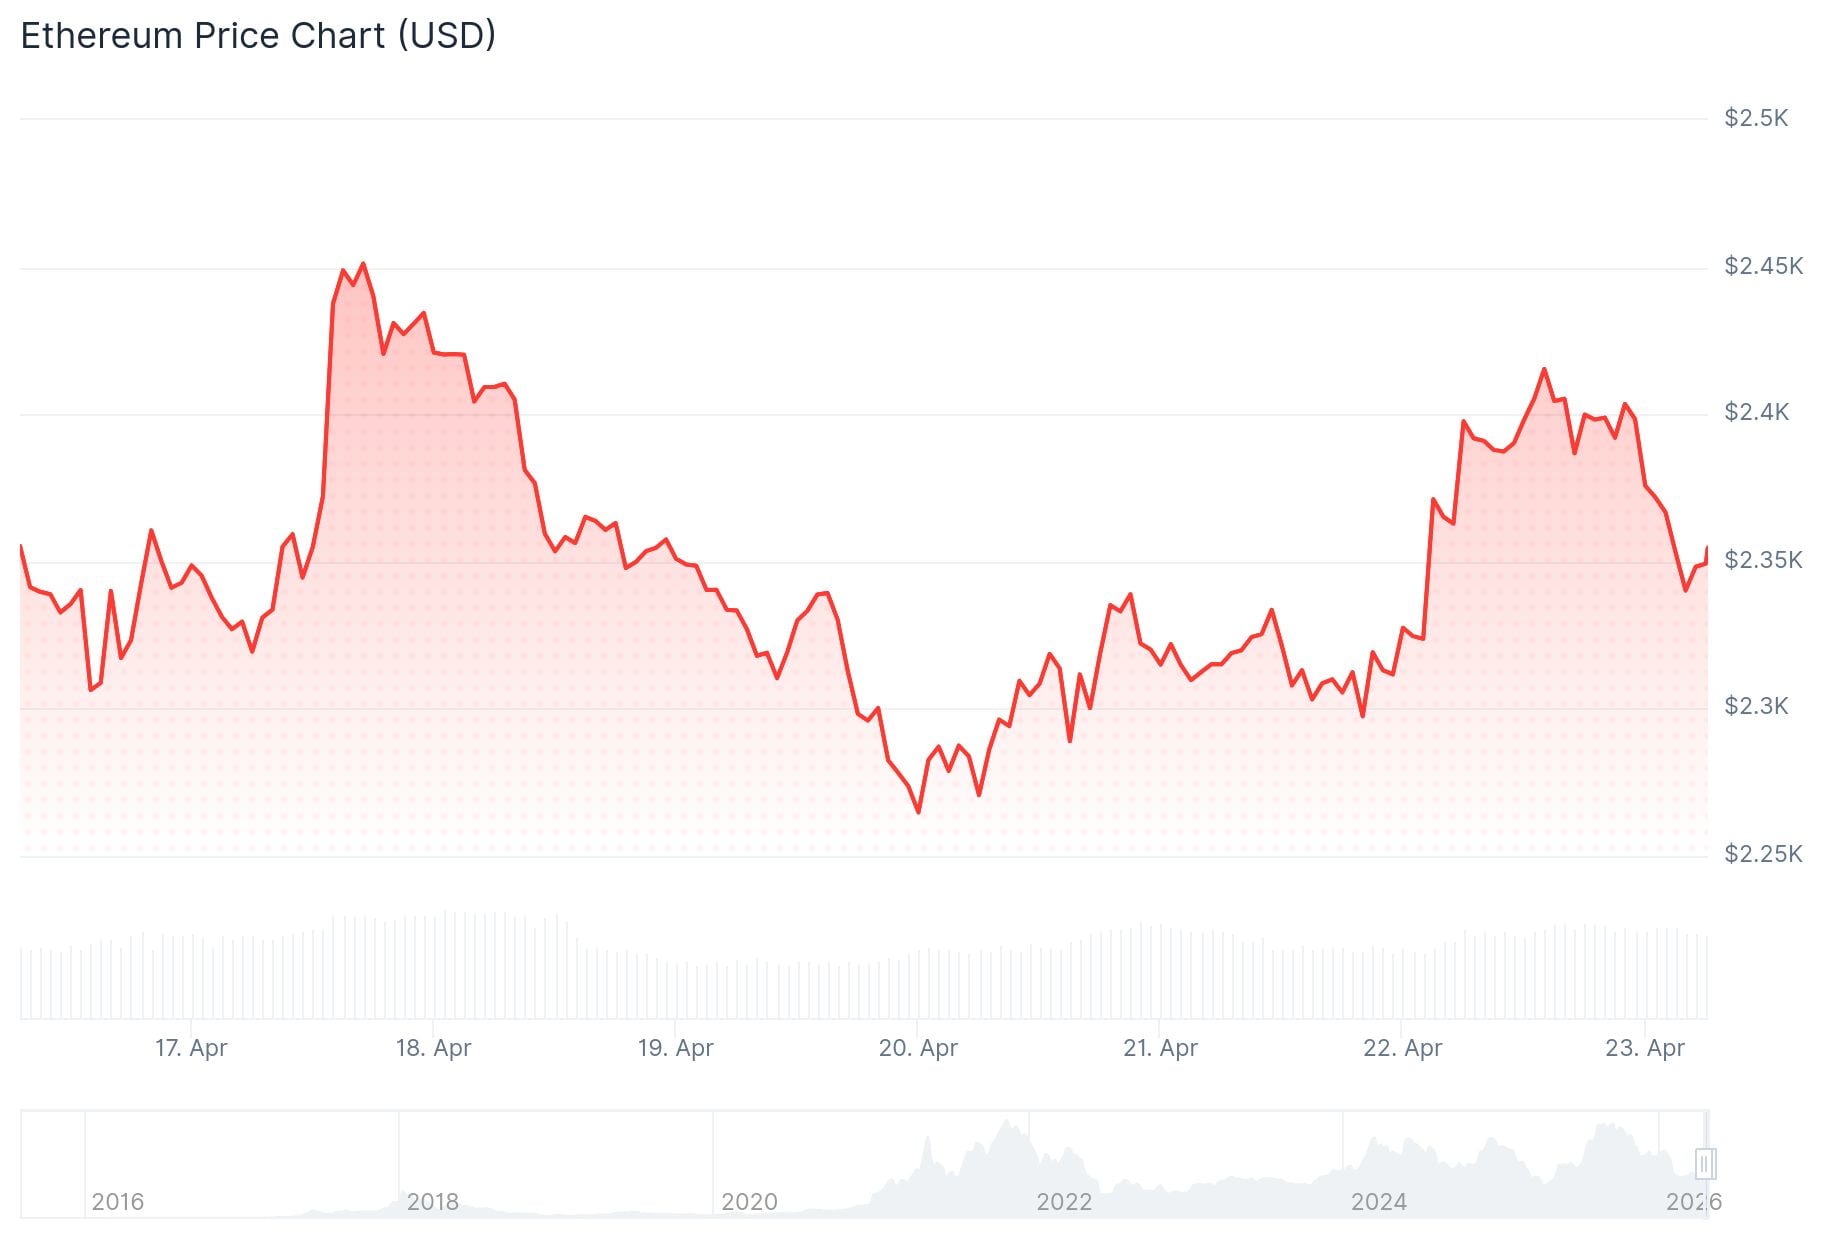
Ethereum is trading near $2,400 after a 10% gain over the past 30 days. Bullish signals are building in derivatives markets, while a bearish technical setup against Bitcoin remains in play. Here is what the data shows.
Ethereum’s funding rates in perpetual futures markets flipped positive this week, sitting around 0.0031% as of writing. That means more traders are positioned long than short. The Taker Buy-Sell Ratio also moved back into bullish territory, showing that buying volume is outpacing selling volume.
Open interest in ETH futures rose by 440,000 ETH in a short window. When measured in ETH terms, open interest has climbed back to levels seen in mid-2025. The all-time high sits about 6% above the current reading.
Short liquidations have been heavy. Over the past seven days, more than $1.6 billion in short positions were wiped out. In a single 24-hour period, nearly $100 million in shorts were liquidated.
ETH ETFs have pulled in close to $494 million over eight straight days of positive net inflows. Trading volumes in the past 24 hours rose 25%, accounting for over 7% of ETH’s circulating market cap.
Staking Supply Squeeze
Ethereum’s staking ratio hit a record 32.33% on April 21. Around 39 million ETH is now locked across 816,578 validators, worth roughly $90.26 billion. This is the first time more than one-third of ETH’s circulating supply has been staked.

The Ethereum Foundation completed its 70,000 ETH staking target earlier this month. BitMine Immersion Technologies holds 4.976 million ETH, with 3.334 million already staked. Less circulating supply generally means reduced selling pressure.

Price Levels to Watch
On the daily chart, Ethereum is holding above its 20-, 50-, and 100-day exponential moving averages, clustered between $2,270 and $2,350. The RSI sits at 60, which analysts generally read as a buy signal.
You've been warned that Ethereum $ETH can go up 20% in a very short period of time (Next several weeks).
Because once we break the 200 weekly moving average (1), there's no real resistance until the 100 weekly moving average (2). pic.twitter.com/MFPH5o0xTV
— Micro2Macr0 (@Micro2Macr0) April 22, 2026
A breakout above $2,466 could confirm an ascending triangle pattern. That would point toward $2,746, then $2,831.
The 200-day EMA sits at $2,650. Analysts expect increased selling pressure at that level. A clean break above it opens the door to $3,000.
Against Bitcoin, the picture is different. ETH/BTC has been forming a bear flag since February. The measured downside target from this pattern is 0.026 BTC — about 10% below current levels — potentially playing out in May.
Immediate downside support sits at $2,388, then $2,352. Deeper support levels are at $2,211 and $2,107.


