


 Price: Whale Accumulation Drives Recovery from Weekly Lows")
TLDR
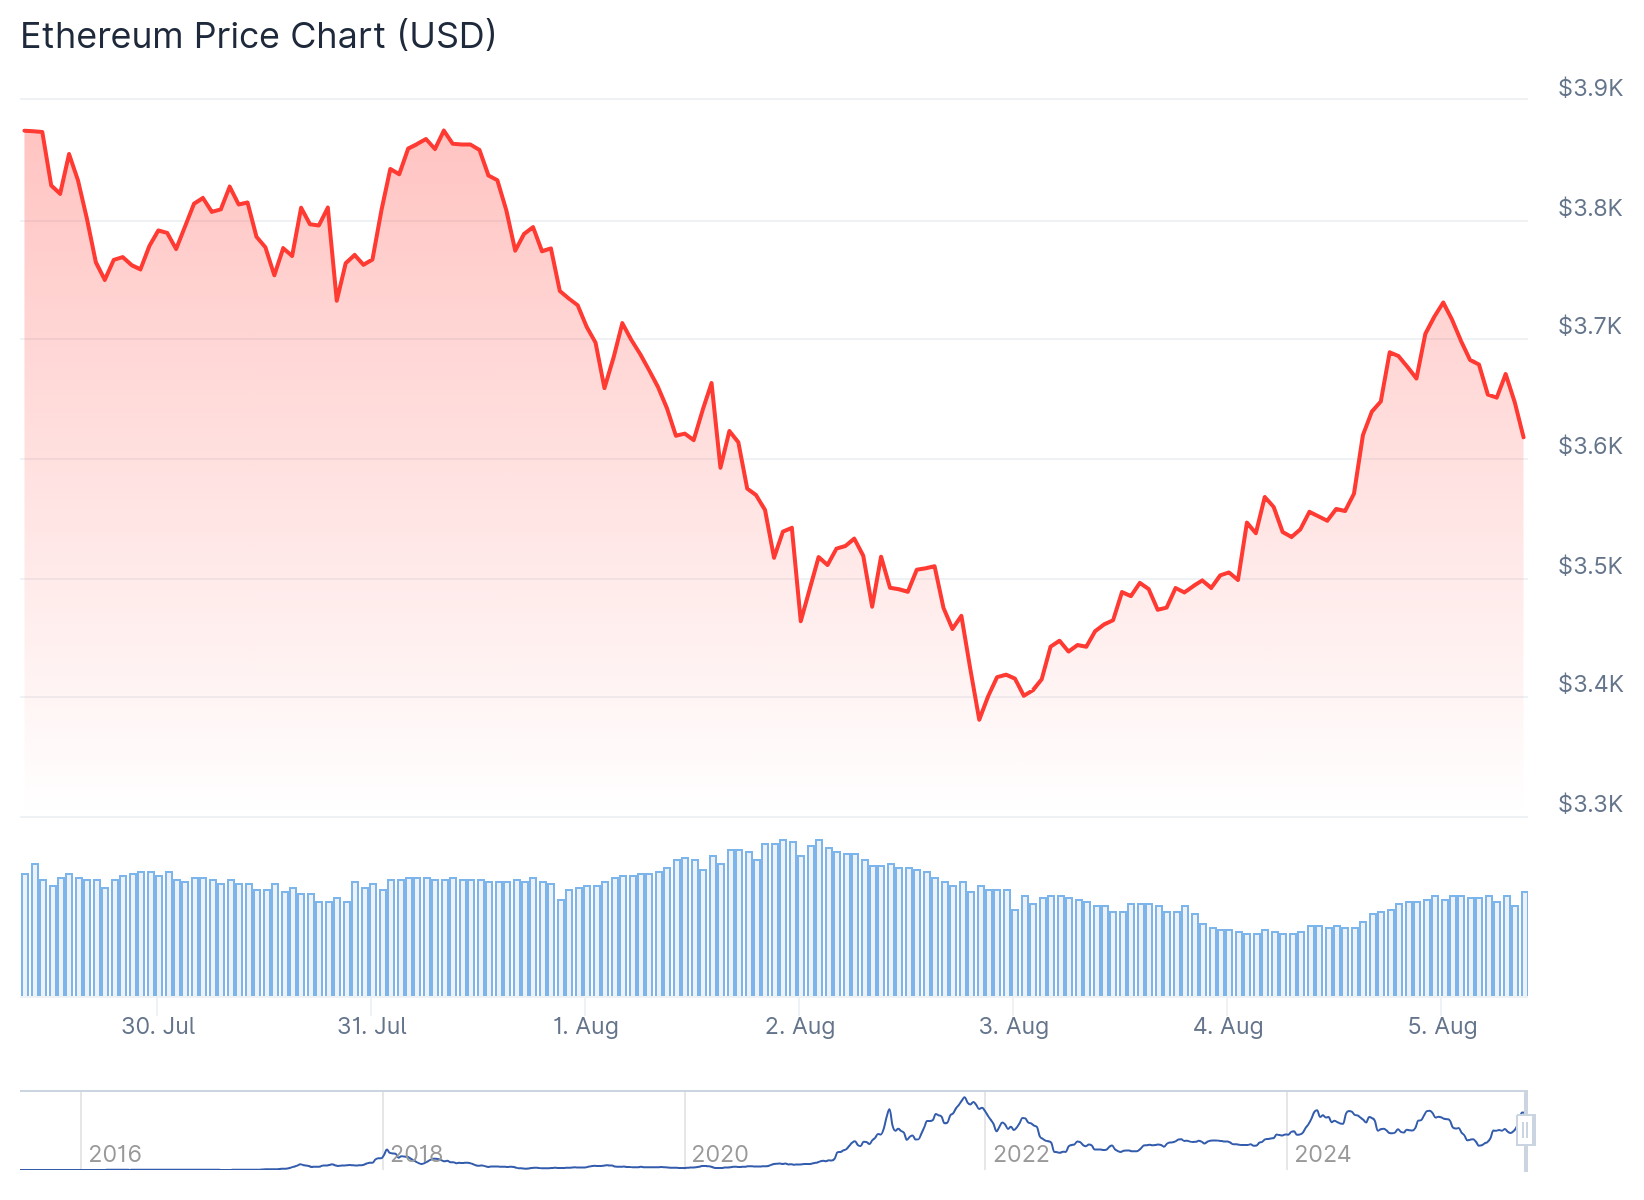
- Ethereum price has jumped over 5% today to around $3,639, recovering from recent losses
- ETH whales purchased $142 million worth of Ethereum in 24 hours through major transactions
- Technical analysis shows a bullish triangle pattern with key resistance at $3,785 and support at $3,356
- Long-short account ratio stands at 1.91, with nearly twice as many long positions as short positions
- Analysts predict ETH could reach $4,000 if it maintains support above $3,537
Ethereum price has staged a strong recovery today, jumping more than 5% to trade around $3,639. The move comes after ETH touched a 24-hour low of $3,456 and reached a high of $3,664.
The second-largest cryptocurrency by market cap has lost nearly 4% over the past week. ETH remains about 27% below its all-time high despite adding around 44% over the last 30 days.
Two major whale transactions drove today’s rally. A newly created wallet received 24,294 ETH worth $86.48 million from FalconX. Another whale purchased 15,627 Ethereum valued at $55.6 million from Galaxy Digital’s OTC wallet.
The combined $142 million in whale purchases reflects growing confidence among large investors. This buying activity coincides with bullish technical signals that suggest ETH may be setting up for further gains.
Whale and Retail Investors Show Bullish Positioning
On-chain data reveals a shift in holder composition over the past 30 days. Whale holdings have increased by 1.82% while retail wallets have grown their exposure by 1.87%.
Mid-size investor wallets have reduced their positions during this period. This redistribution toward whales and retail suggests conviction at both ends of the investor spectrum.
IntoTheBlock’s Bull vs Bear address chart shows bulls outnumbering bears by seven addresses over the past week. Bulls are defined as wallets that bought over 1% of daily traded volume, while bears sold at least that amount.


Binance’s long-short account ratio currently stands at 1.91. This means nearly twice as many trader accounts hold long positions compared to short positions.
Technical Analysis Points to Bullish Triangle Pattern
Ethereum’s daily chart shows a bullish ascending triangle pattern following its move from $2,120 to $3,939. The price has been consolidating in a tight range with key levels clearly defined.
The 0.236 Fibonacci trend extension level at $3,785 represents crucial resistance. A daily close above this level could trigger a move toward $3,939 and potentially $4,051.
Support sits at $3,356, which was briefly tested yesterday before the price rebounded. A break below this level would invalidate the bullish setup.
Futures open interest rose 0.7% to $48.24 billion according to CoinGlass data. This indicates sustained trader interest despite recent price volatility.
I think that these boxes on $ETH are still valid.
It's a good bounce, but not convincing as of yet, through which there's a good chance we'll be revisiting these lows before we start to make new ATHs. pic.twitter.com/fboiUEUx2c
— Michaël van de Poppe (@CryptoMichNL) August 4, 2025
Analyst Michael van de Poppe noted that ETH’s recent bounce is “not convincing as of yet.” He believes the price must hold $3,537 support to reach $4,100. In a deeper correction scenario, he sees $2,700 as major support.
Ali Martinez highlighted $2,924 as strong support for Ethereum. If this level fails, the next potential support sits at $2,750.
US Spot Ethereum ETFs recorded an outflow of $152.3 million on August 1 during the broader market crash. However, CoinShares data shows ETH attracted $133.9 million in inflows last week while Bitcoin saw $404 million in outflows.


