


 Price: Whale with 100% Win Rate Opens $131 Million Long Position")


TLDR
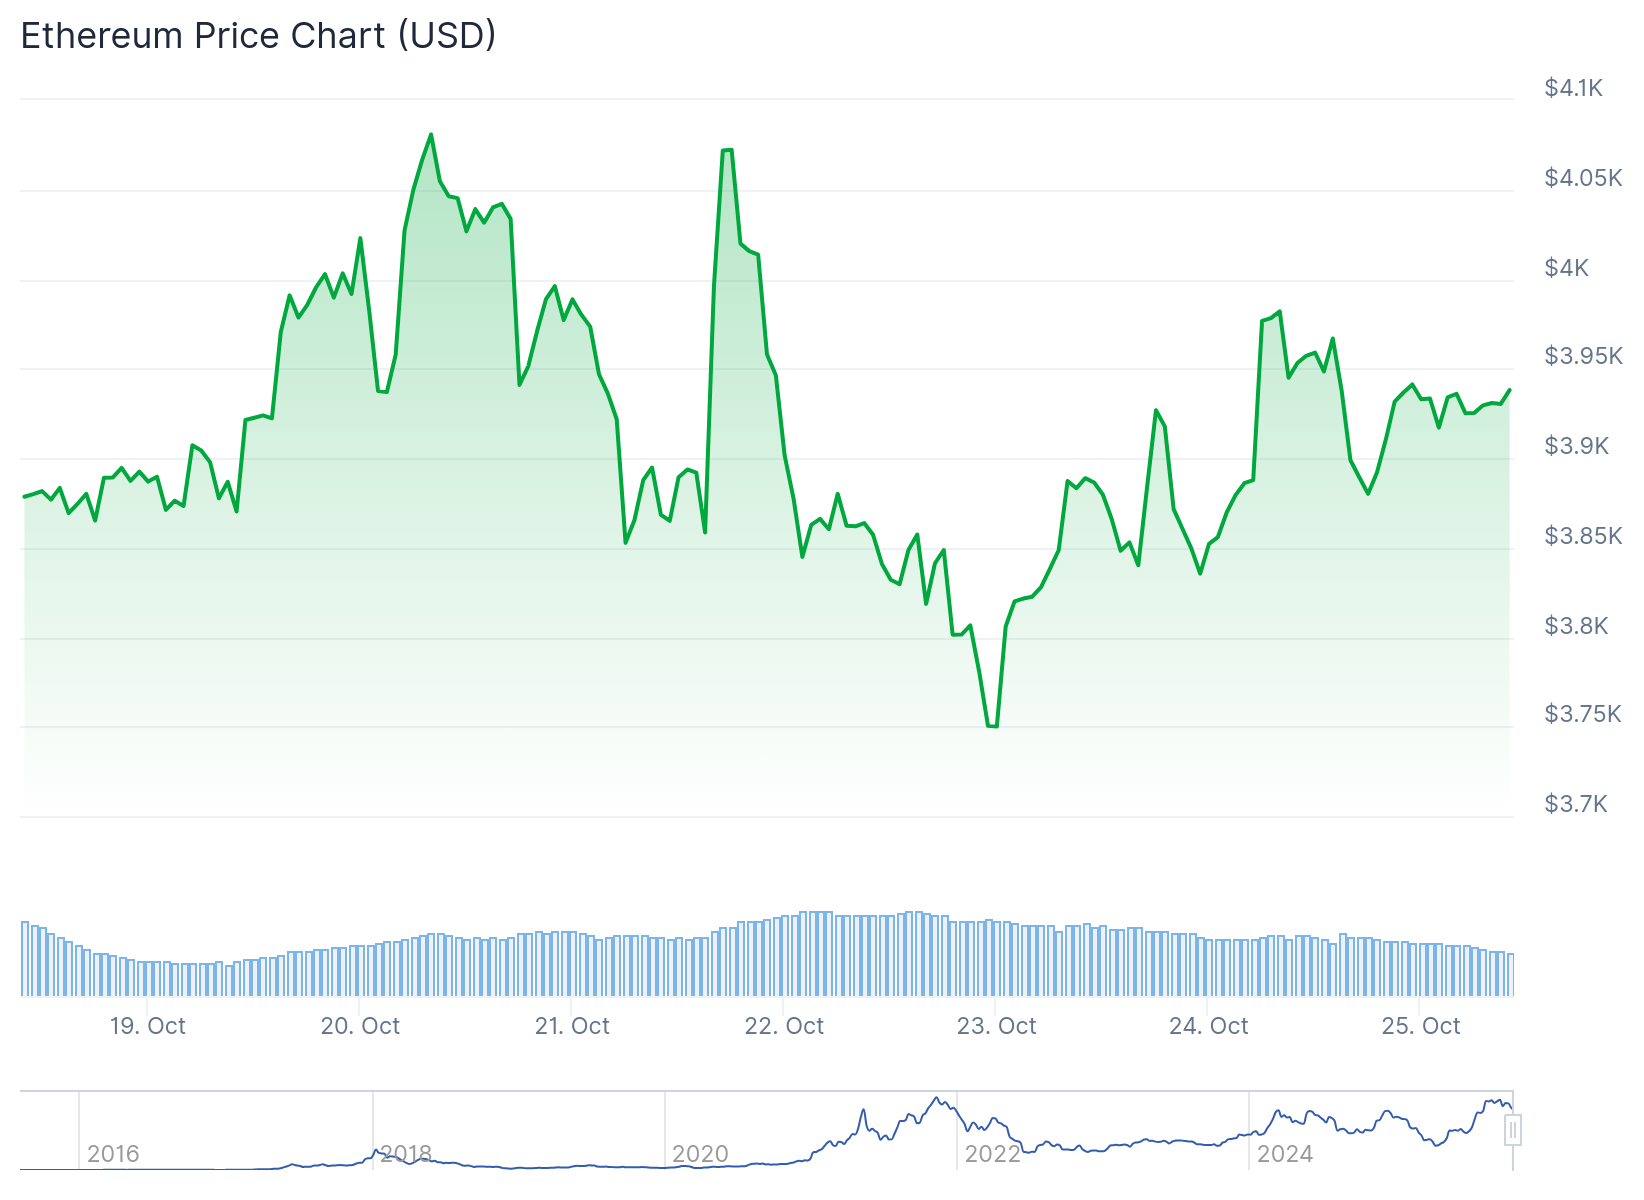
- Ethereum’s price reached $4,025 on Friday as bulls pushed above the $4,000 level for the first time in recent trading sessions
- A trader with a 100% win rate increased their ETH long position to 33,270 ETH worth $131.24 million, betting on further price gains
- Exchange reserves of ETH hit their lowest level in years as more holders move coins off exchanges, creating potential supply squeeze conditions
- Tom Lee predicts Ethereum could reach between $12,000 and $22,000 based on institutional adoption and DeFi ecosystem growth
- Community sentiment shows 82% bullish outlook with strong support holding at $3,800 and resistance targets set at $4,300
Ethereum traded at $3,961.86 on Friday after touching an intraday high of $4,025. The move represents a 1.95% gain over 24 hours and a 5.39% increase over the past week.
Trading volume reached $37.47 billion in the last 24 hours. The market capitalization stands at $478 billion.
A trader known for perfect timing increased their Ethereum position to 33,270 ETH. This position is currently valued at $131.24 million at current prices.
Smart trader 0xc2a3, with a 100% win rate, has increased his $ETH long position to 33,270 $ETH($131.24M).
He also opened a 4x long on 80 $BTC($8.9M).
His total profit has now surpassed $15.4M.https://t.co/XzFH3jrgx2 pic.twitter.com/QnP0ZBSG0d
— Lookonchain (@lookonchain) October 24, 2025
The same trader maintains a 100% win rate on their trades. They also opened a 4X leveraged long position on 80 Bitcoin worth $8.9 million.
Data shows the trader has already collected $16 million in profits over the past two weeks. The new positions suggest they expect continued upward movement in both Ethereum and Bitcoin prices.
Exchange data reveals ETH reserves have dropped to multi-year lows. More holders are moving their coins into private wallets rather than keeping them on exchanges.

This pattern often precedes price increases. When supply decreases on exchanges, it reduces selling pressure and can create conditions for rapid price movement.
Technical Levels and Targets
Traders are watching the $4,100 level as the next barrier. This price point has acted as resistance with strong sell orders clustered around it.
$ETH Chopping around this region. For me it's pretty simple:
– Below the 10th of October wick & Daily 200EMA would not be good for the high timeframe picture. This level sits at roughly $3.5K. Think that's a must hold.
– To get things going again, you'd want to break back above… https://t.co/9piFNx5aa4 pic.twitter.com/oaBC8nUlPu
— Daan Crypto Trades (@DaanCrypto) October 23, 2025
Breaking above $4,100 could trigger a move toward $4,300. Some analysts project targets as high as $4,500 by the end of October.
The $3,800 level has proven to be strong support. Buyers have defended this price point multiple times in recent trading sessions.
One analyst maintains a long-term price target of $10,000 for Ethereum. This projection depends on the asset holding above previous high levels.
Institutional Predictions
Market strategist Tom Lee released a forecast suggesting Ethereum’s fair value sits between $12,000 and $22,000. Lee points to institutional adoption and the growing tokenization sector as primary drivers.
His analysis focuses on Ethereum’s role in decentralized finance infrastructure. The network serves as the foundation for most DeFi applications and smart contracts.
If Lee’s lower estimate proves accurate, current prices would represent substantial undervaluation. The prediction has generated discussion among traders and investors.
The Consumer Price Index report for September was scheduled for Friday release. The data is expected to show inflation at 3.1%.
Federal Reserve rate cut odds stood at over 94% according to CME FedWatch tool. Most market participants expect the central bank to proceed with cuts regardless of the inflation reading.
Mega whales holding between 10,000 and 100,000 Ethereum show signs of accumulation. These large holders have been adding to positions at current price levels.
Community sentiment polling shows 82% bullish outlook among respondents. Only 18% of participants expressed bearish expectations for near-term price action.
Chart patterns suggest a continuation structure is forming. Technical analysts identify this as a setup that typically precedes further upward movement.
The $4,250 resistance level represents the next major hurdle after $4,100. Clearing both levels would open the path toward the $4,750 demand zone.
Trading activity remains elevated with billions in daily volume. Current data shows sustained interest from both retail and institutional participants.


