


TLDR
- ETH loses the $2,000 pivot, flipping former support into firm resistance for short-term structure.
- Elliott Wave setup signals potential continuation toward the $1,910–$1,920 demand zone.
- Higher timeframe weakness follows rejection at $2,800, confirming macro deterioration.
- Fibonacci analysis highlights $1,886 and $1,821 as critical areas for buyer response.
Ethereum(ETH) price is trading under sustained pressure as it struggles to hold the $2,000 psychological level. Recent charts show a decisive breakdown below former range support, shifting short-term momentum to the downside. Intraday and higher-timeframe structures both reflect lower highs and expanding bearish waves. Analysts suggest that failure to reclaim $2,000 could expose deeper support levels.
Ethereum Price Breaks Key $2,000 Pivot
According to analyst Crypto Tony, Ethereum price confirmed a structural breakdown after losing support around the $1,995–$2,000 level. This level acted as a session pivot before sellers forced a decisive move lower. Once price closed below the range, momentum accelerated sharply. The former support zone has now flipped into resistance.
The Elliott Wave count shows a developing five-wave impulse downward. Wave (i) began near $2,040–$2,050 and triggered the initial breakdown. Wave (ii) produced a brief corrective bounce but failed to reclaim $2,000. The strong wave (iii) extension pushed ETH price toward $1,960, reflecting heavy selling pressure.

Meanwhile, wave (iv) formed a weak recovery into $1,980–$2,000 resistance. Sellers re-engaged before bulls could regain structure. The projected wave (v) targets support near $1,910–$1,920. If $1,920 fails, the asset may test $1,880 next. A sustained move above $2,000 would invalidate the immediate bearish sequence.
Higher Timeframe Shows Macro Breakdown
In the meantime, analyst Ted Pillows highlighted broader weakness on the ETH against USD chart. A strong resistance band between $2,800 and $2,850 capped recovery attempts. After failing to reclaim this zone, Ethereum rolled over sharply. The breakdown below $2,400–$2,450 confirmed macro trend deterioration.
The most recent decline sliced beneath $2,100 and reached the $1,950–$1,980 range. Price then wicked into a demand zone between $1,740 and $1,850. This zone previously served as a base before the 2023 rally. Historically, such zones attract dip buyers within corrective phases.
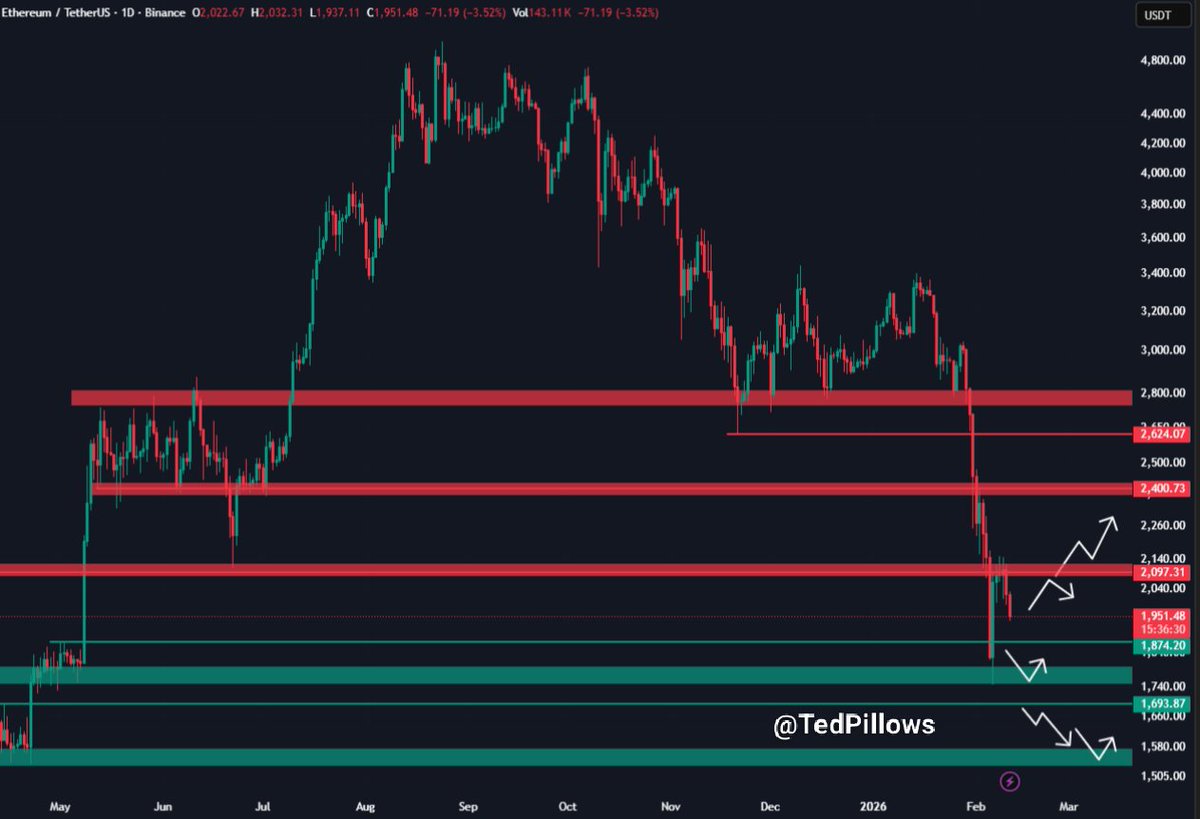
However, the structure still reflects lower highs and lower lows. If Ethereum price fails to hold above $1,850, the next supports appear near $1,700 and $1,580–$1,600. On the upside, reclaiming $2,100 would signal early strength. A sustained break above $2,400 is required to shift the broader bearish structure.

Fibonacci Levels Define Downside Risk
Additionally, analyst More Crypto provided context using Fibonacci retracement levels. Price topped near $2,160 before entering a complex corrective sequence. The key resistance zone sits between $2,033 and $1,999. This 38.2% to 50% retracement band marks a critical invalidation area for short-term bulls.
The breakdown below $1,999 confirmed continuation of the corrective pattern. Downside targets include $1,932, $1,886, and $1,821. Ethereum price has already moved through $1,932 and is approaching deeper retracement support. The 61.8% level at $1,886 remains technically significant.

Furthermore, the wave count suggests a potential completion near $1,821–$1,886. This zone could attract responsive buying within the crypto market. However, losing $1,820 would expose $1,750 next. Unti ETHl price reclaims $2,033–$2,050, the corrective-to-bearish bias remains intact.


