


 Price: Breaks Three-Year Consolidation Pattern as Payment Adoption Surges")
TLDR
- LTC price jumped 10.85% in 24 hours, breaking out of a three-year sideways trading pattern
- Litecoin climbed to second place in crypto payments on CoinGate platform with 14.5% market share
- Network processed its 340 millionth transaction, marking 12% of all LTC transactions since 2011 happening in 2025 alone
- ETF approval odds at 80% are driving institutional interest in the cryptocurrency
- RSI at 80.31 indicates overbought conditions but bullish momentum continues
Litecoin has broken free from a three-year consolidation pattern with a sharp price surge that caught traders’ attention. The cryptocurrency jumped 10.85% in the past 24 hours, pushing its price to around $122.85.
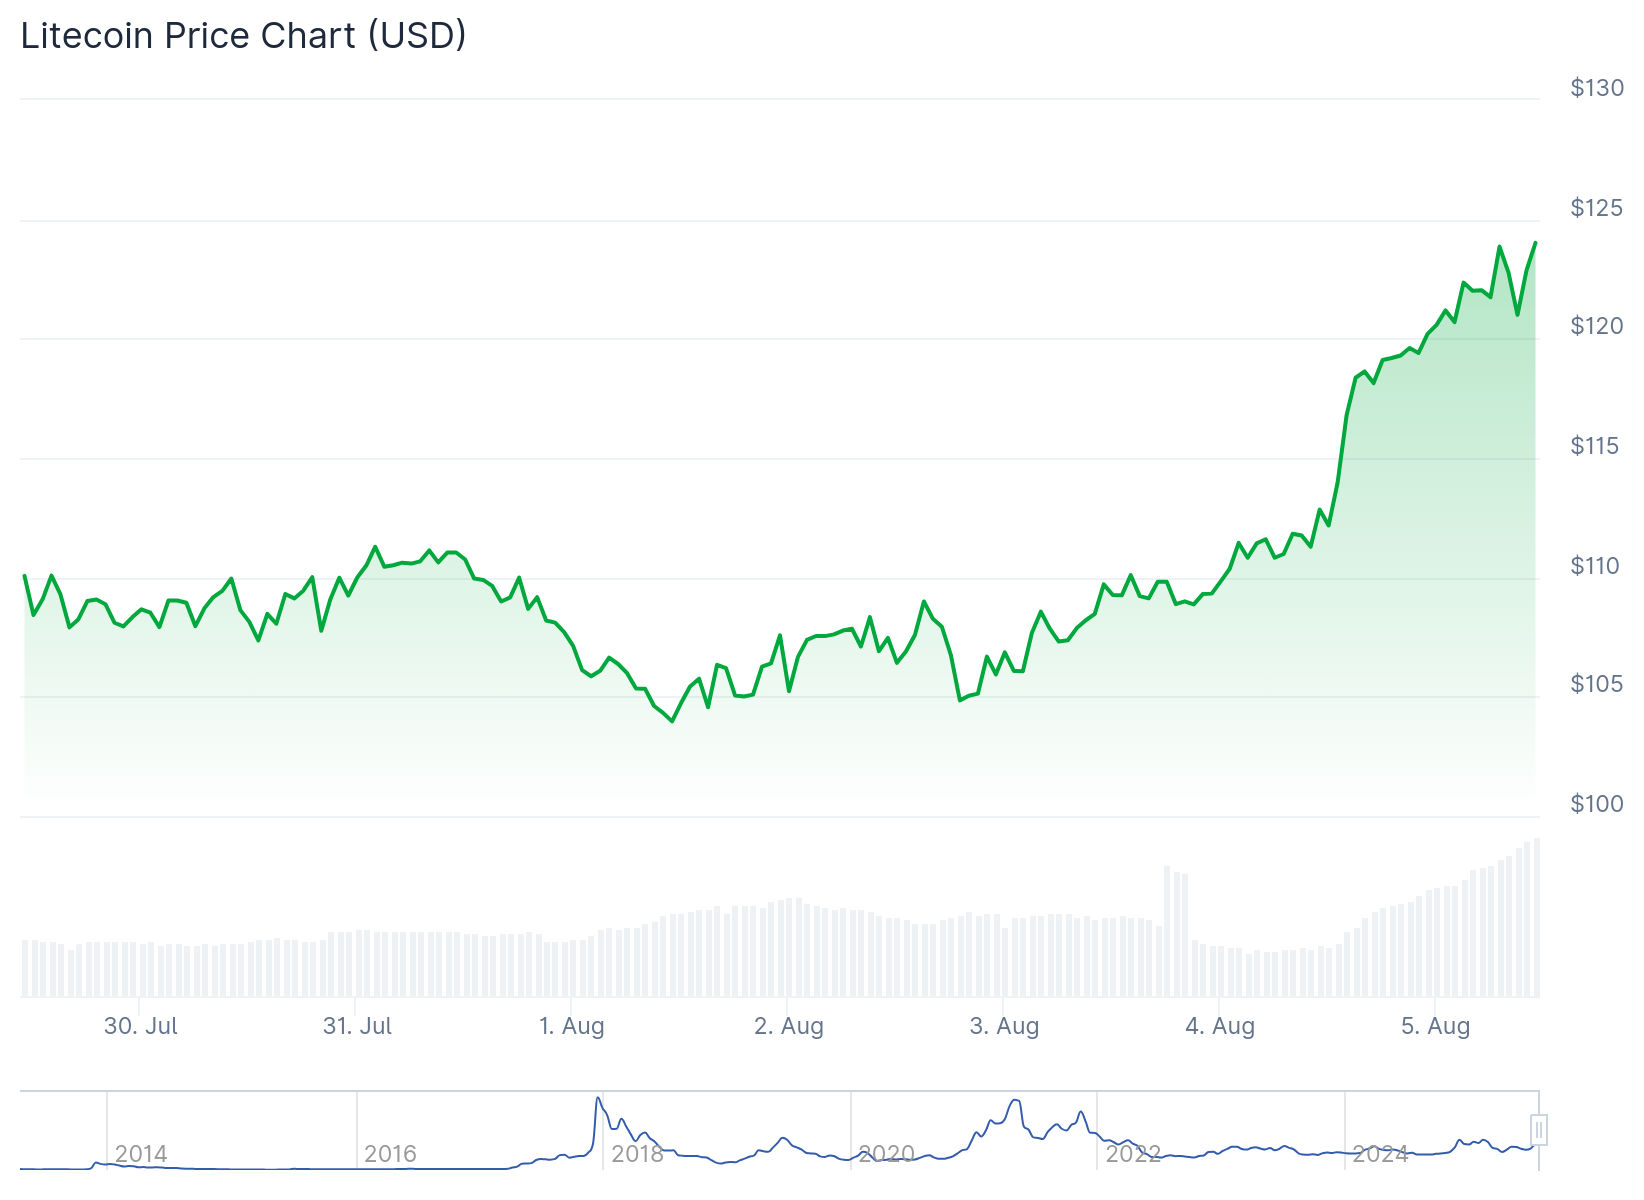
The breakout occurred when LTC surged past its multi-month resistance level of $110.70 on August 4. This previous resistance zone has now flipped to become a support level for future price action.
Trading volume has exploded alongside the price movement. The 24-hour volume surged 170% to reach $1.48 billion, showing strong trader interest in the cryptocurrency.
Growing Payment Adoption
Recent data from CoinGate reveals Litecoin’s growing dominance in the crypto payments sector. The Lithuanian payment processor reported that LTC now holds second place among user preferences with a 14.5% market share.
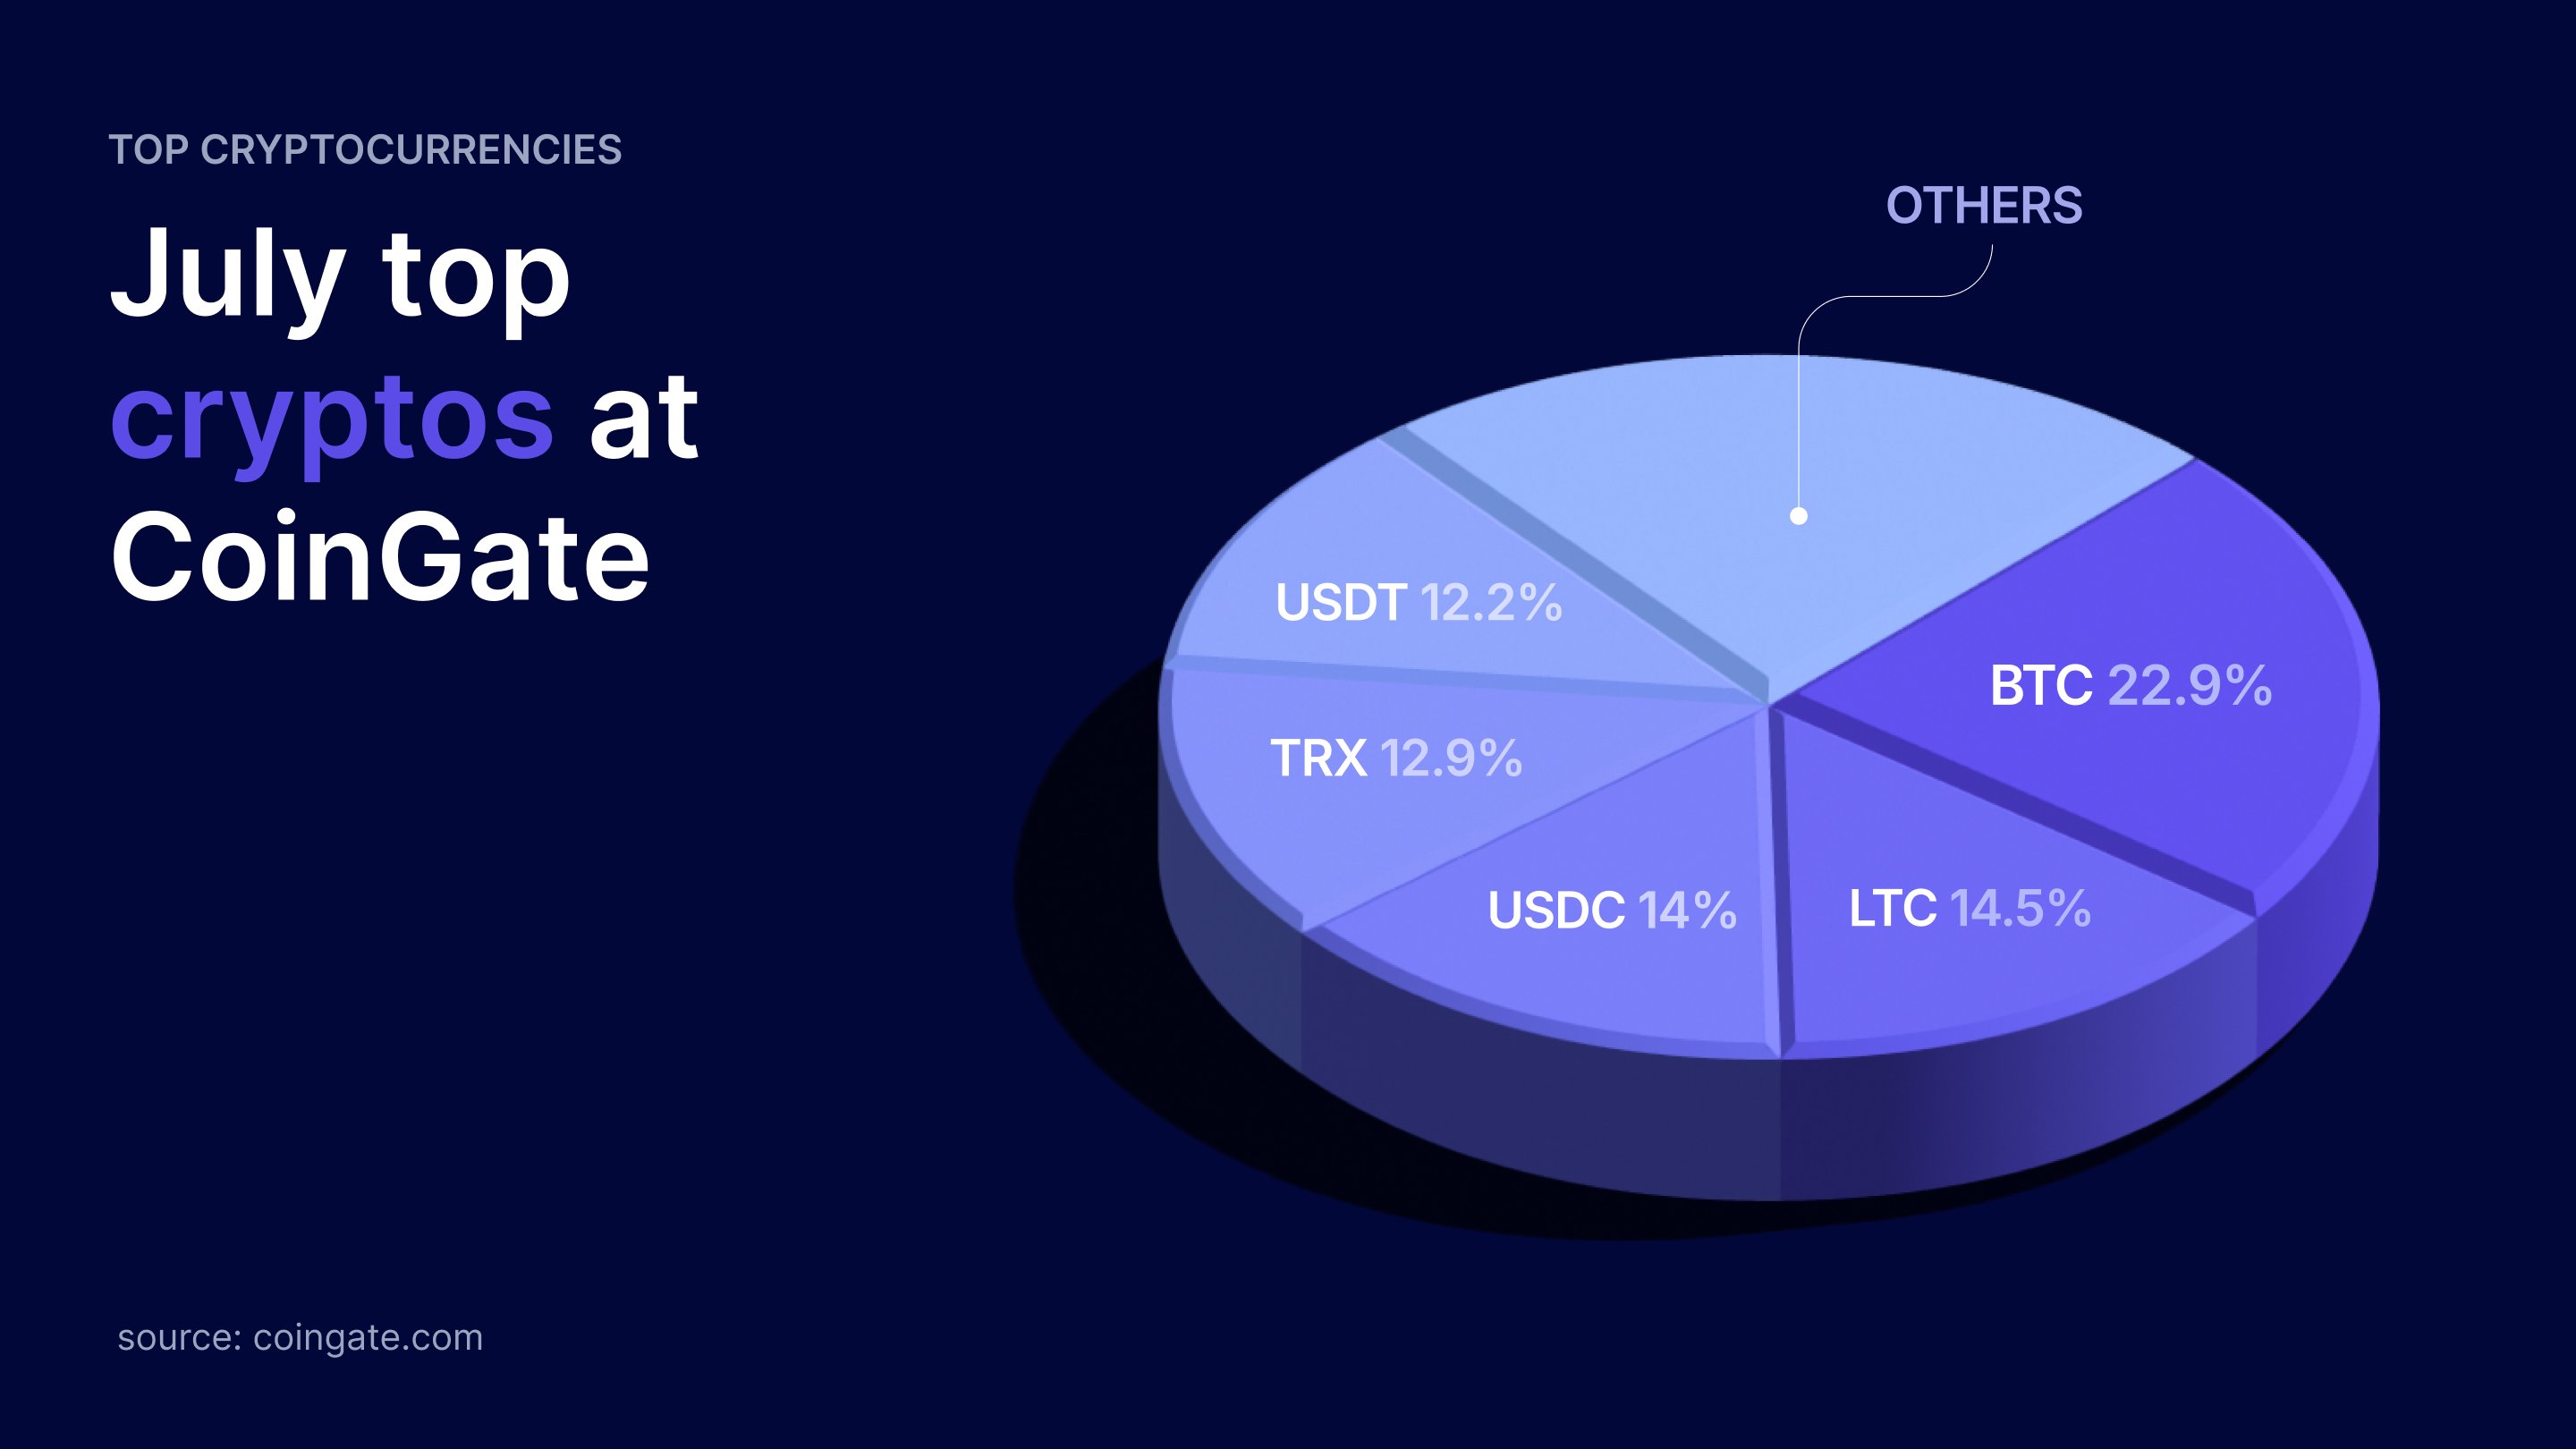
Bitcoin remains the leader with 22.9% of payments on the platform. USDC follows in third place at 14%, while USDT captures 12.2% of the market share.
This payment adoption reflects Litecoin’s core strengths as a transaction medium. The network offers fast settlement times and low transaction fees compared to many other cryptocurrencies.
For the first half of 2025, Litecoin maintained a strong position with 13.6% of CoinGate’s payment volume. This placed it just ahead of Ethereum at 13.5% during the same period.

The network has processed impressive transaction volumes this year. Litecoin recently hit its 340 millionth transaction milestone, up from 300 million in early January 2025.
This means 12% of all Litecoin transactions since the network launched in 2011 have occurred in 2025 alone. The statistic highlights the accelerating adoption rate of the cryptocurrency.
Technical Indicators Point Higher
The technical picture for Litecoin shows strong bullish momentum. The Bollinger Bands have expanded sharply on the 4-hour chart, indicating increased volatility with LTC hugging the upper band at $122.94.
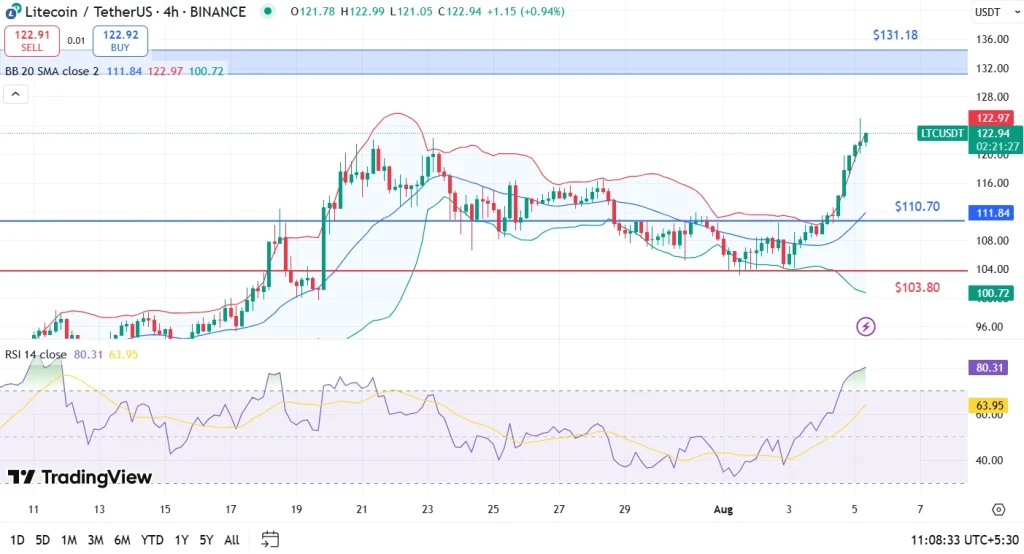
The Relative Strength Index sits at 80.31, which indicates overbought conditions. However, the price remains above the 20-period simple moving average at $111.84, supporting the bullish trend.
The next resistance level sits at $131.18 based on Fibonacci retracement levels. If momentum continues, a move toward $144.56 appears achievable according to technical analysis.
Support levels remain at $110.70 and $107.89 if the price pulls back. The stop loss for trades can be placed at $103.80, below the 38.2% retracement zone.
ETF speculation has also contributed to the bullish sentiment. Current approval odds stand at 80%, fueling institutional optimism around the cryptocurrency.
The combination of technical breakouts, payment adoption growth, and institutional interest has pushed Litecoin’s market cap to $9.35 billion. This represents its strongest position in years as the cryptocurrency emerges from its extended consolidation phase.

